Lowe's 2014 Annual Report Download - page 46
Download and view the complete annual report
Please find page 46 of the 2014 Lowe's annual report below. You can navigate through the pages in the report by either clicking on the pages listed below, or by using the keyword search tool below to find specific information within the annual report.-
 1
1 -
2
-
3
-
4
-
5
-
6
-
7
-
8
-
9
-
10
-
11
-
12
-
13
-
14
-
15
-
16
-
17
-
18
-
19
-
20
-
21
-
22
-
23
-
24
-
25
-
26
-
27
-
28
-
29
-
30
-
31
-
32
-
33
-
34
-
35
-
 36
36 -
 37
37 -
 38
38 -
 39
39 -
 40
40 -
 41
41 -
 42
42 -
 43
43 -
 44
44 -
 45
45 -
 46
46 -
 47
47 -
 48
48 -
 49
49 -
 50
50 -
 51
51 -
 52
52 -
 53
53 -
 54
54 -
 55
55 -
 56
56 -
57
-
58
-
59
-
60
-
61
-
62
-
63
-
64
-
65
-
66
-
67
-
68
-
69
-
70
-
71
-
72
-
73
-
74
-
75
-
76
-
77
-
78
-
79
-
80
-
81
-
82
-
83
-
84
-
85
-
86
-
87
-
88
-
89
-
90
-
91
-
92
-
93
-
94
 |
 |

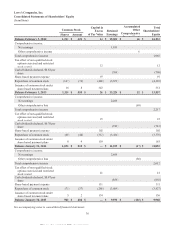
Lowe's Companies, Inc.
Consolidated Statements of Shareholders' Equity
(In millions)
Common Stock Capital in
Excess
of Par Value
Retained
Earnings
Accumulated
Other
Comprehensive
Income/(Loss)
Tot al
Shareholders'
Equity
Shares Amount
Balance February 3, 2012 1,241
$ 621
$ 14
$ 15,852 $ 46
$ 16,533
Comprehensive income:
Net earnings 1,959
Other comprehensive income 6
Total comprehensive income 1,965
Tax effect of non-qualified stock
options exercised and restricted
stoc
k
vested
12
12
Cash dividends declared, $0.62 per
share (708 ) (708)
Share-based payment expense 97
97
Repurchase of common stock (147 ) (74 ) (440 ) (3,879 ) (4,393)
Issuance of common stock under
share-based
p
a
y
ment
p
lans 16
8
343
351
Balance February 1, 2013 1,110
$ 555
$ 26
$ 13,224 $ 52
$ 13,857
Comprehensive income:
Net earnings 2,286
Other comprehensive loss (69 )
Total comprehensive income 2,217
Tax effect of non-qualified stock
options exercised and restricted
stoc
k
vested
25
25
Cash dividends declared, $0.70 per
share (741 ) (741)
Share-based payment expense 102
102
Repurchase of common stock (88 ) (44 ) (312 ) (3,414 ) (3,770)
Issuance of common stock under
share-based
p
a
y
ment
p
lans 8
4
159
163
Balance January 31, 2014 1,030
$ 515
$
—
$ 11,355 $ (17 )
$ 11,853
Comprehensive income:
Net earnings 2,698
Other comprehensive loss (86 )
Total comprehensive income 2,612
Tax effect of non-qualified stock
options exercised and restricted
stoc
k
vested
41
41
Cash dividends declared, $0.87 per
share (858 ) (858)
Share-based payment expense 111
111
Repurchase of common stock (75 ) (37 ) (286 ) (3,604 ) (3,927)
Issuance of common stock under
share-based
p
a
y
ment
p
lans 5
2
134
136
Balance January 30, 2015 960
$ 480
$
—
$ 9,591 $ (103 )
$ 9,968
See accompanying notes to consolidated financial statements.
36
This proof is printed at 96% of original size
This line represents final trim and will not print