Lowe's 2014 Annual Report Download - page 72
Download and view the complete annual report
Please find page 72 of the 2014 Lowe's annual report below. You can navigate through the pages in the report by either clicking on the pages listed below, or by using the keyword search tool below to find specific information within the annual report.-
 1
1 -
2
-
3
-
4
-
5
-
6
-
7
-
8
-
9
-
10
-
11
-
12
-
13
-
14
-
15
-
16
-
17
-
18
-
19
-
20
-
21
-
22
-
23
-
24
-
25
-
26
-
27
-
28
-
29
-
30
-
31
-
32
-
33
-
34
-
35
-
36
-
37
-
38
-
39
-
40
-
41
-
42
-
43
-
44
-
45
-
46
-
47
-
48
-
49
-
50
-
51
-
52
-
53
-
54
-
55
-
56
-
57
-
58
-
59
-
60
-
61
-
 62
62 -
 63
63 -
 64
64 -
 65
65 -
 66
66 -
 67
67 -
 68
68 -
 69
69 -
 70
70 -
 71
71 -
 72
72 -
 73
73 -
 74
74 -
 75
75 -
 76
76 -
 77
77 -
 78
78 -
 79
79 -
 80
80 -
 81
81 -
 82
82 -
83
-
84
-
85
-
86
-
87
-
88
-
89
-
90
-
91
-
92
-
93
-
94
 |
 |

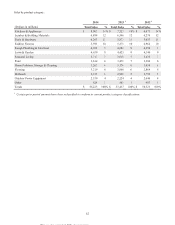
Sales by product category:
2014 2013 1 2012 1
(Dollars in millions) Total Sales % Total Sales % To ta l Sa le s %
Kitchens & Appliances $ 8,007
14% $ 7,527
14 % $ 6,973
14 %
Lumber & Building Materials 6,884
12 6,596
12
6,276
12
Tools & Hardware 6,263
11 5,873
11
5,633
11
Fashion Fixtures 5,591
10 5,271
10
4,964
10
Rough Plumbing & Electrical 4,928
9 4,684
9
4,356
9
Lawn & Garden 4,639
8
4,423
8
4,340
9
Seasonal Living 3,717
7 3,615
7
3,433
7
Paint 3,614
6
3,471
7
3,306
6
Home Fashions, Storage & Cleaning 3,263
6 3,176
6
3,050
6
Flooring 3,219
6
3,066
6
2,864
6
Millwork 3,135
6 2,926
5
2,793
5
Outdoor Power Equipment 2,339
4
2,224
4
2,046
4
Other 624
1 565
1
487
1
Totals $ 56,223
100% $ 53,417
100 % $ 50,521
100 %
1 Certain prior period amounts have been reclassified to conform to current product category classifications.
62
This proof is printed at 96% of original size
This line represents final trim and will not print