Lowe's 2014 Annual Report Download - page 57
Download and view the complete annual report
Please find page 57 of the 2014 Lowe's annual report below. You can navigate through the pages in the report by either clicking on the pages listed below, or by using the keyword search tool below to find specific information within the annual report.-
 1
1 -
2
-
3
-
4
-
5
-
6
-
7
-
8
-
9
-
10
-
11
-
12
-
13
-
14
-
15
-
16
-
17
-
18
-
19
-
20
-
21
-
22
-
23
-
24
-
25
-
26
-
27
-
28
-
29
-
30
-
31
-
32
-
33
-
34
-
35
-
36
-
37
-
38
-
39
-
40
-
41
-
42
-
43
-
44
-
45
-
46
-
 47
47 -
 48
48 -
 49
49 -
 50
50 -
 51
51 -
 52
52 -
 53
53 -
 54
54 -
 55
55 -
 56
56 -
 57
57 -
 58
58 -
 59
59 -
 60
60 -
 61
61 -
 62
62 -
 63
63 -
 64
64 -
 65
65 -
 66
66 -
 67
67 -
68
-
69
-
70
-
71
-
72
-
73
-
74
-
75
-
76
-
77
-
78
-
79
-
80
-
81
-
82
-
83
-
84
-
85
-
86
-
87
-
88
-
89
-
90
-
91
-
92
-
93
-
94
 |
 |

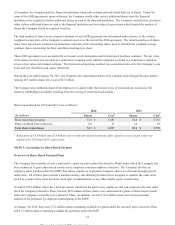
from property brokers or appraisers included comparable sales of similar assets and assumptions about demand in the market
for these assets.
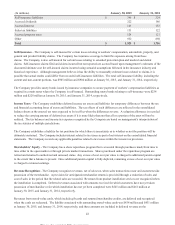
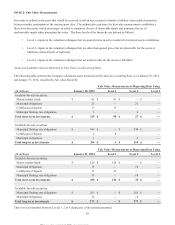
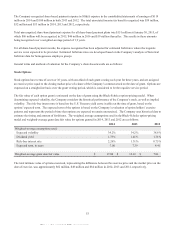
During 2014, the Company incurred total impairment charges of $2 million for 10 excess property locations. A 10% reduction
in the estimated selling prices for these excess properties at the dates the locations were evaluated for impairment would have
increased impairment losses by approximately $1 million.
The following table presents the Company’s non-financial assets measured at estimated fair value on a nonrecurring basis and
the resulting long-lived asset impairment losses included in earnings, excluding costs to sell for excess properties held-for-sale.
Because assets subject to long-lived asset impairment were not measured at fair value on a recurring basis, certain fair value
measurements presented in the table may reflect values at earlier measurement dates and may no longer represent the fair
values at January 30, 2015 and January 31, 2014.
Fair Value Measurements - Nonrecurring Basis
January 30, 2015 January 31, 2014
(In millions) Fair Value
Measurements Impairment
Losses Fair Value
Measurements Impairment
Losses
Assets-held-for-use:
Operating locations $ 9
$ (26 ) $ 13
$ (26 )
Excess properties 11
(2 ) 56
(17)
Assets-held-for-sale:
Excess properties
—
—
4
(2)
Total $ 20
$ (28 )
$ 73
$ (45 )
Fair Value of Financial Instruments
The Company’s financial instruments not measured at fair value on a recurring basis include cash and cash equivalents,
accounts receivable, accounts payable, accrued liabilities, and long-term debt and are reflected in the financial statements at
cost. With the exception of long-term debt, cost approximates fair value for these items due to their short-term nature. The fair
values of the Company’s unsecured notes classified as Level 1 were estimated using quoted market prices. The fair values of
the Company’s mortgage notes classified as Level 2 were estimated using discounted cash flow analyses, based on the future
cash outflows associated with these arrangements and discounted using the applicable incremental borrowing rate.
Carrying amounts and the related estimated fair value of the Company’s long-term debt, excluding capitalized lease
obligations, are as follows:
January 30, 2015 January 31, 2014
(In millions) Carrying
Amount Fair Value Carrying
Amount Fair Value
Unsecured notes (Level 1) $ 10,860
$ 12,739
$ 9,617
$ 10,630
Mortgage notes (Level 2) 16
17
17
19
Long-term debt (excluding capitalized lease
obli
g
ations
)
$ 10,876
$ 12,756
$ 9,634
$ 10,649
47
This proof is printed at 96% of original size
This line represents final trim and will not print