Lowe's 2014 Annual Report Download - page 58
Download and view the complete annual report
Please find page 58 of the 2014 Lowe's annual report below. You can navigate through the pages in the report by either clicking on the pages listed below, or by using the keyword search tool below to find specific information within the annual report.-
 1
1 -
2
-
3
-
4
-
5
-
6
-
7
-
8
-
9
-
10
-
11
-
12
-
13
-
14
-
15
-
16
-
17
-
18
-
19
-
20
-
21
-
22
-
23
-
24
-
25
-
26
-
27
-
28
-
29
-
30
-
31
-
32
-
33
-
34
-
35
-
36
-
37
-
38
-
39
-
40
-
41
-
42
-
43
-
44
-
45
-
46
-
47
-
 48
48 -
 49
49 -
 50
50 -
 51
51 -
 52
52 -
 53
53 -
 54
54 -
 55
55 -
 56
56 -
 57
57 -
 58
58 -
 59
59 -
 60
60 -
 61
61 -
 62
62 -
 63
63 -
 64
64 -
 65
65 -
 66
66 -
 67
67 -
 68
68 -
69
-
70
-
71
-
72
-
73
-
74
-
75
-
76
-
77
-
78
-
79
-
80
-
81
-
82
-
83
-
84
-
85
-
86
-
87
-
88
-
89
-
90
-
91
-
92
-
93
-
94
 |
 |

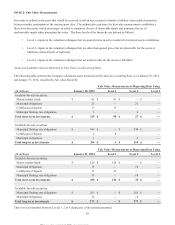
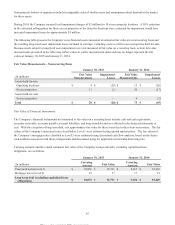
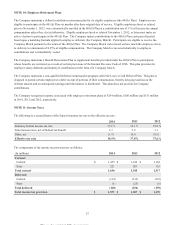
NOTE 3: Investments
The amortized costs, gross unrealized holding gains and losses, and fair values of the Company’s investment securities
classified as available-for-sale at January 30, 2015, and January 31, 2014 are as follows:
January 30, 2015
(In millions) Amortized Costs Gross Unrealized
Gains Gross Unrealized
Losses Fair
Val ue s
Money market funds $ 81 $
—
$
—
$ 81
Municipal obligations 21
—
—
21
Certificates of deposit 17
—
—
17
Municipal floating rate obligations 6
—
—
6
Classified as short-term 125
—
—
125
Municipal floating rate obligations 348
—
—
348
Certificates of deposit 4
—
—
4
Municipal obligations 2
—
—
2
Classified as long-term 354
—
—
354
Total $ 479 $
—
$
—
$ 479
January 31, 2014
(In millions) Amortized Costs Gross Unrealized
Gains Gross Unrealized
Losses Fair
Val ue s
Money market funds $ 128 $
—
$
—
$ 128
Municipal obligations 18
—
—
18
Certificates of deposit 21
—
—
21
Municipal floating rate obligations 18
—
—
18
Classified as short-term 185
—
—
185
Municipal floating rate obligations 265
—
—
265
Municipal obligations 14
—
—
14
Classified as long-term 279
—
—
279
Tot al $ 464 $
—
$
—
$ 464
The proceeds from sales of available-for-sale securities were $283 million, $276 million and $1.1 billion for 2014, 2013 and
2012, respectively. Gross realized gains and losses on the sale of available-for-sale securities were not significant for any of the
periods presented. The investments classified as long-term at January 30, 2015, will mature in one to 37 years, based on stated
maturity dates.
Short-term and long-term investments include restricted balances pledged as collateral primarily for the Company’s extended
protection plan program. Restricted balances included in short-term investments were $99 million at January 30, 2015, and
$162 million at January 31, 2014. Restricted balances included in long-term investments were $305 million at January 30,
2015, and $268 million at January 31, 2014.
48
This proof is printed at 96% of original size
This line represents final trim and will not print