Lowe's 2014 Annual Report Download - page 31
Download and view the complete annual report
Please find page 31 of the 2014 Lowe's annual report below. You can navigate through the pages in the report by either clicking on the pages listed below, or by using the keyword search tool below to find specific information within the annual report.-
 1
1 -
2
-
3
-
4
-
5
-
6
-
7
-
8
-
9
-
10
-
11
-
12
-
13
-
14
-
15
-
16
-
17
-
18
-
19
-
20
-
 21
21 -
 22
22 -
 23
23 -
 24
24 -
 25
25 -
 26
26 -
 27
27 -
 28
28 -
 29
29 -
 30
30 -
 31
31 -
 32
32 -
 33
33 -
 34
34 -
 35
35 -
 36
36 -
 37
37 -
 38
38 -
 39
39 -
 40
40 -
 41
41 -
42
-
43
-
44
-
45
-
46
-
47
-
48
-
49
-
50
-
51
-
52
-
53
-
54
-
55
-
56
-
57
-
58
-
59
-
60
-
61
-
62
-
63
-
64
-
65
-
66
-
67
-
68
-
69
-
70
-
71
-
72
-
73
-
74
-
75
-
76
-
77
-
78
-
79
-
80
-
81
-
82
-
83
-
84
-
85
-
86
-
87
-
88
-
89
-
90
-
91
-
92
-
93
-
94
 |
 |

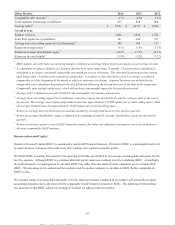
Gross margin – Gross margin of 34.79% for 2014 represented a 20 basis point increase from 2013 and was primarily driven by
cost reductions associated with our Value Improvement initiative, which consisted of improved line review and product reset
processes to better position us to meet customers' product needs and drive better inventory productivity.
During the fourth quarter of 2014, gross margin decreased one basis point as a percentage of sales. Gross margin was
negatively impacted by mix of products sold and price actions on specific categories, partially offset by our Value Improvement
program and better seasonal sell-through.
SG&A – SG&A expense for 2014 leveraged 46 basis points as a percentage of sales compared to 2013. This was primarily
driven by 21 basis points of leverage associated with operating salaries as we optimized payroll hours against customer traffic.
We also experienced 16 basis points of leverage associated with incentive compensation due to lower attainment levels
compared to the prior year and seven basis points of leverage in property taxes due to favorability in property valuations
recognized in the current year. In addition, we experienced six basis points of leverage in advertising expense due to increased
sales and five basis points of leverage in utilities due to decreased consumption due to favorable weather experienced in the
current year. These were partially offset by 23 basis points of deleverage in employee insurance costs, due to increased claims
as well as additional costs associated with the Affordable Care Act.
SG&A expense during the fourth quarter leveraged 88 basis points due primarily to long-lived asset impairments recorded in
the prior year, as well as leverage in operating salaries, and property taxes.
Depreciation – Depreciation expense leveraged 10 basis points for 2014 compared to 2013 primarily due to the increase in
sales. Property, less accumulated depreciation, decreased to $20.0 billion at January 30, 2015 compared to $20.8 billion at
January 31, 2014. At January 30, 2015 and January 31, 2014, we owned 86% of our stores, which included stores on leased
land.
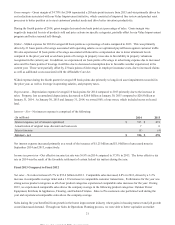
Interest – Net – Net interest expense is comprised of the following:
(In millions) 2014 2013
Interest expense, net of amount capitalized $ 515
$ 474
Amortization of original issue discount and loan costs 7
6
Interest income (6 ) (4 )
Interest - net $ 516
$ 476
Net interest expense increased primarily as a result of the issuance of $1.25 billion and $1.0 billion of unsecured notes in
September 2014 and 2013, respectively.
Income tax provision - Our effective income tax rate was 36.9% in 2014 compared to 37.8% in 2013. The lower effective tax
rate in 2014 was the result of the favorable settlement of certain federal tax matters during the year.
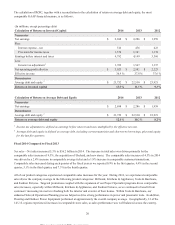
Fiscal 2013 Compared to Fiscal 2012
Net sales – Net sales increased 5.7% to $53.4 billion in 2013. Comparable sales increased 4.8% in 2013, driven by a 3.2%
increase in comparable average ticket and a 1.6% increase in comparable customer transactions. Performance for the year was
strong across product categories as all of our product categories experienced comparable sales increases for the year. During
2013, we experienced comparable sales above the company average in the following product categories: Outdoor Power
Equipment, Kitchens & Appliances, Flooring, and Fashion Fixtures. Sales to Pro customers also performed well during the
year and experienced comparable sales above the company average.
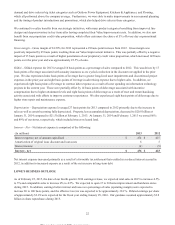
Sales during the year benefited from growth in the home improvement industry where gains in housing turnover and job growth
created increased demand. Through our Sales & Operations Planning process, we were able to better capitalize on market
21
This proof is printed at 96% of original size
This line represents final trim and will not print