Lowe's 2014 Annual Report Download - page 32
Download and view the complete annual report
Please find page 32 of the 2014 Lowe's annual report below. You can navigate through the pages in the report by either clicking on the pages listed below, or by using the keyword search tool below to find specific information within the annual report.-
 1
1 -
2
-
3
-
4
-
5
-
6
-
7
-
8
-
9
-
10
-
11
-
12
-
13
-
14
-
15
-
16
-
17
-
18
-
19
-
20
-
21
-
 22
22 -
 23
23 -
 24
24 -
 25
25 -
 26
26 -
 27
27 -
 28
28 -
 29
29 -
 30
30 -
 31
31 -
 32
32 -
 33
33 -
 34
34 -
 35
35 -
 36
36 -
 37
37 -
 38
38 -
 39
39 -
 40
40 -
 41
41 -
 42
42 -
43
-
44
-
45
-
46
-
47
-
48
-
49
-
50
-
51
-
52
-
53
-
54
-
55
-
56
-
57
-
58
-
59
-
60
-
61
-
62
-
63
-
64
-
65
-
66
-
67
-
68
-
69
-
70
-
71
-
72
-
73
-
74
-
75
-
76
-
77
-
78
-
79
-
80
-
81
-
82
-
83
-
84
-
85
-
86
-
87
-
88
-
89
-
90
-
91
-
92
-
93
-
94
 |
 |

demand and drive sales in big ticket categories such as Outdoor Power Equipment, Kitchens & Appliances, and Flooring,
which all performed above the company average. Furthermore, we were able to make improvements in our seasonal planning
and the timing of product introductions and promotions, which also helped drive sales in these categories.
We continued to realize benefits from our strategic initiatives, with many product categories benefiting from improved line
designs and deeper inventory in key items after having completed their Value Improvement resets. In addition, we also saw
benefit from our proprietary credit value proposition, which offers customers the choice of 5% off every day or promotional
financing.
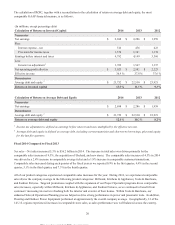
Gross margin – Gross margin of 34.59% for 2013 represented a 29 basis point increase from 2012. Gross margin was
positively impacted by 45 basis points resulting from our Value Improvement initiative. This was partially offset by a negative
impact of 15 basis points as a result of higher penetration of our proprietary credit value proposition, which increased 145 basis
points over the prior year and was approximately 25.5% of sales.
SG&A – SG&A expense for 2013 leveraged 16 basis points as a percentage of sales compared to 2012. This was driven by 17
basis points of leverage associated with casualty insurance as we cycled a reduction in the discount rate applied in the prior
year. We also experienced nine basis points of leverage due to greater long-lived asset impairments and discontinued project
expenses in the prior year and eight basis points of leverage in advertising expense due to higher sales. In addition, we
experienced eight basis points of leverage in contract labor expense as a result of lower spending on information technology
projects in the current year. These were partially offset by 14 basis points of deleverage associated with incentive
compensation due to higher attainment levels and eight basis points of deleverage as a result of reset and remerchandising
activity associated with efforts to improve customer experiences. We also experienced eight basis points of deleverage due to
higher store repair and maintenance expense.
Depreciation – Depreciation expense leveraged 27 basis points for 2013 compared to 2012 primarily due to the increase in
sales as well as assets becoming fully depreciated. Property, less accumulated depreciation, decreased to $20.8 billion at
January 31, 2014 compared to $21.5 billion at February 1, 2013. At January 31, 2014 and February 1, 2013 we owned 86%
and 89% of our stores, respectively, which included stores on leased land.
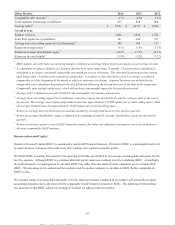
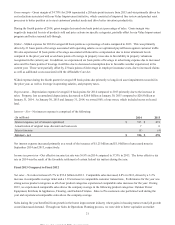
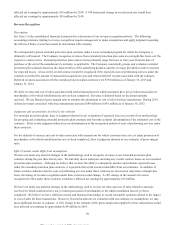
Interest – Net – Net interest expense is comprised of the following:
(In millions) 2013 2012
Interest expense, net of amount capitalized $ 474
$ 427
Amortization of original issue discount and loan costs 6
5
Interest income (4 ) (9 )
Interest - net $ 476
$ 423
Net interest expense increased primarily as a result of a favorable tax settlement that resulted in a reduced interest accrual in
2012, in addition to increased expense as a result of the net increase in long-term debt.
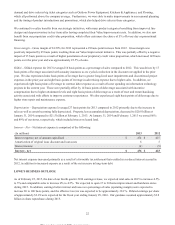
LOWE’S BUSINESS OUTLOOK
As of February 25, 2015, the date of our fourth quarter 2014 earnings release, we expected total sales in 2015 to increase 4.5%
to 5% and comparable sales to increase 4% to 4.5%. We expected to open 15 to 20 home improvement and hardware stores
during 2015. In addition, earnings before interest and taxes as a percentage of sales (operating margin) were expected to
increase 80 to 100 basis points, and the effective tax rate was expected to be approximately 38.1%. Diluted earnings per share
of approximately $3.29 were expected for the fiscal year ending January 29, 2016. Our guidance assumed approximately $3.8
billion in share repurchases during 2015.
22
This proof is printed at 96% of original size
This line represents final trim and will not print