Lowe's 2014 Annual Report Download - page 30
Download and view the complete annual report
Please find page 30 of the 2014 Lowe's annual report below. You can navigate through the pages in the report by either clicking on the pages listed below, or by using the keyword search tool below to find specific information within the annual report.-
 1
1 -
2
-
3
-
4
-
5
-
6
-
7
-
8
-
9
-
10
-
11
-
12
-
13
-
14
-
15
-
16
-
17
-
18
-
19
-
 20
20 -
 21
21 -
 22
22 -
 23
23 -
 24
24 -
 25
25 -
 26
26 -
 27
27 -
 28
28 -
 29
29 -
 30
30 -
 31
31 -
 32
32 -
 33
33 -
 34
34 -
 35
35 -
 36
36 -
 37
37 -
 38
38 -
 39
39 -
 40
40 -
41
-
42
-
43
-
44
-
45
-
46
-
47
-
48
-
49
-
50
-
51
-
52
-
53
-
54
-
55
-
56
-
57
-
58
-
59
-
60
-
61
-
62
-
63
-
64
-
65
-
66
-
67
-
68
-
69
-
70
-
71
-
72
-
73
-
74
-
75
-
76
-
77
-
78
-
79
-
80
-
81
-
82
-
83
-
84
-
85
-
86
-
87
-
88
-
89
-
90
-
91
-
92
-
93
-
94
 |
 |

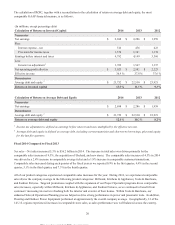
The calculation of ROIC, together with a reconciliation to the calculation of return on average debt and equity, the most
comparable GAAP financial measure, is as follows:
(In millions, except percentage data)
Calculation of Return on Invested Capital 2014 2013 2012
Numerator
Net earnings $ 2,698 $ 2,286
$ 1,959
Plus:
Interest expense - net 516 476 423
Provision for income taxes 1,578 1,387 1,178
Earnings before interest and taxes 4,792 4,149 3,560
Less:
Income tax adjustment 1 1,769 1,567 1,337
Net operating profit after tax $ 3,023 $ 2,582
$ 2,223
Effective tax rate 36.9 % 37.8 % 37.6 %
Denominator
Average debt and equity 2 $ 21,752 $ 22,510
$ 23,921
Return on invested capital 13.9%
11.5 % 9.3 %
Calculation of Return on Average Debt and Equity 2014 2013 2012
Numerator
Net earnings $ 2,698 $ 2,286
$ 1,959
Denominator
Average debt and equity 2 $ 21,752 $ 22,510
$ 23,921
Return on average debt and equity 12.4%
10.2% 8.2 %
1 Income tax adjustment is defined as earnings before interest and taxes multiplied by the effective tax rate.
2 Average debt and equity is defined as average debt, including current maturities and short-term borrowings, plus total equity
for the last five quarters.
Fiscal 2014 Compared to Fiscal 2013
Net sales – Net sales increased 5.3% to $56.2 billion in 2014. The increase in total sales was driven primarily by the
comparable sales increase of 4.3%, the acquisition of Orchard, and new stores. The comparable sales increase of 4.3% in 2014
was driven by a 2.4% increase in comparable average ticket and a 1.8% increase in comparable customer transactions.
Comparable sales increased during each quarter of the fiscal year as we reported 0.9% in the first quarter, 4.4% in the second
quarter, 5.1% in the third quarter, and 7.3% in the fourth quarter.
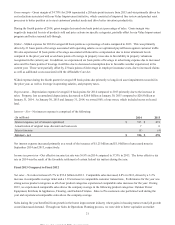
All of our product categories experienced comparable sales increases for the year. During 2014, we experienced comparable
sales above the company average in the following product categories: Millwork, Kitchens & Appliances, Tools & Hardware,
and Fashion Fixtures. Targeted promotions coupled with the expansion of our Project Specialist programs drove comparable
sales increases, especially within Millwork, Kitchens & Appliances, and Fashion Fixtures, as we continued to benefit from
customers' increasing interest in refreshing both the interior and exterior of their homes. Within Tools & Hardware, our
enhanced Sales & Operations Planning process helped us drive strong performance in power and pneumatic tools. In addition,
Flooring and Outdoor Power Equipment performed at approximately the overall company average. Geographically, 13 of the
14 U.S. regions experienced increases in comparable store sales, as sales performance was well balanced across the country.
20
This proof is printed at 96% of original size
This line represents final trim and will not print