Lowe's 2014 Annual Report Download - page 63
Download and view the complete annual report
Please find page 63 of the 2014 Lowe's annual report below. You can navigate through the pages in the report by either clicking on the pages listed below, or by using the keyword search tool below to find specific information within the annual report.-
 1
1 -
2
-
3
-
4
-
5
-
6
-
7
-
8
-
9
-
10
-
11
-
12
-
13
-
14
-
15
-
16
-
17
-
18
-
19
-
20
-
21
-
22
-
23
-
24
-
25
-
26
-
27
-
28
-
29
-
30
-
31
-
32
-
33
-
34
-
35
-
36
-
37
-
38
-
39
-
40
-
41
-
42
-
43
-
44
-
45
-
46
-
47
-
48
-
49
-
50
-
51
-
52
-
 53
53 -
 54
54 -
 55
55 -
 56
56 -
 57
57 -
 58
58 -
 59
59 -
 60
60 -
 61
61 -
 62
62 -
 63
63 -
 64
64 -
 65
65 -
 66
66 -
 67
67 -
 68
68 -
 69
69 -
 70
70 -
 71
71 -
 72
72 -
 73
73 -
74
-
75
-
76
-
77
-
78
-
79
-
80
-
81
-
82
-
83
-
84
-
85
-
86
-
87
-
88
-
89
-
90
-
91
-
92
-
93
-
94
 |
 |

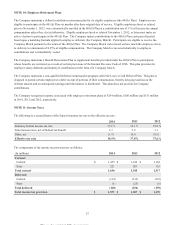
The Company recognized share-based payment expense in SG&A expense in the consolidated statements of earnings of $119
million in 2014 and $100 million in both 2013 and 2012. The total associated income tax benefit recognized was $39 million,
$32 million and $33 million in 2014, 2013 and 2012, respectively.
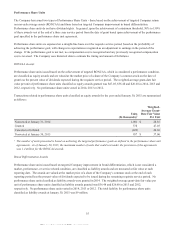
Total unrecognized share-based payment expense for all share-based payment plans was $151 million at January 30, 2015, of
which $86 million will be recognized in 2015, $46 million in 2016 and $19 million thereafter. This results in these amounts
being recognized over a weighted-average period of 1.9 years.
For all share-based payment awards, the expense recognized has been adjusted for estimated forfeitures where the requisite
service is not expected to be provided. Estimated forfeiture rates are developed based on the Company’s analysis of historical
forfeiture data for homogeneous employee groups.
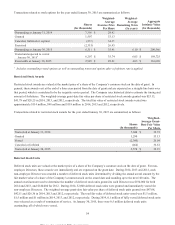
General terms and methods of valuation for the Company’s share-based awards are as follows:
Stock Options
Stock options have terms of seven or 10 years, with one-third of each grant vesting each year for three years, and are assigned
an exercise price equal to the closing market price of a share of the Company’s common stock on the date of grant. Options are
expensed on a straight-line basis over the grant vesting period, which is considered to be the requisite service period.
The fair value of each option grant is estimated on the date of grant using the Black-Scholes option-pricing model. When
determining expected volatility, the Company considers the historical performance of the Company’s stock, as well as implied
volatility. The risk-free interest rate is based on the U.S. Treasury yield curve in effect at the time of grant, based on the
options’ expected term. The expected term of the options is based on the Company’s evaluation of option holders’ exercise
patterns and represents the period of time that options are expected to remain unexercised. The Company uses historical data to
estimate the timing and amount of forfeitures. The weighted average assumptions used in the Black-Scholes option-pricing
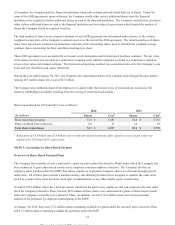
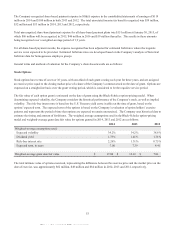
model and weighted-average grant date fair value for options granted in 2014, 2013 and 2012 are as follows:
2014 2013 2012
Weighted-average assumptions used:
Expected volatility 34.2 % 34.2 % 38.6 %
Dividend yield 1.73 % 1.45 % 1.76 %
Risk-free interest rate 2.26 % 1.31 % 0.75 %
Expected term, in years 7.00 7.39 4.41
Weighted-average grant date fair value $ 17.00
$ 12.24
$ 7.84
The total intrinsic value of options exercised, representing the difference between the exercise price and the market price on the
date of exercise, was approximately $62 million, $48 million and $84 million in 2014, 2013 and 2012, respectively.
53
This proof is printed at 96% of original size
This line represents final trim and will not print