Lowe's 2014 Annual Report Download - page 45
Download and view the complete annual report
Please find page 45 of the 2014 Lowe's annual report below. You can navigate through the pages in the report by either clicking on the pages listed below, or by using the keyword search tool below to find specific information within the annual report.-
 1
1 -
2
-
3
-
4
-
5
-
6
-
7
-
8
-
9
-
10
-
11
-
12
-
13
-
14
-
15
-
16
-
17
-
18
-
19
-
20
-
21
-
22
-
23
-
24
-
25
-
26
-
27
-
28
-
29
-
30
-
31
-
32
-
33
-
34
-
 35
35 -
 36
36 -
 37
37 -
 38
38 -
 39
39 -
 40
40 -
 41
41 -
 42
42 -
 43
43 -
 44
44 -
 45
45 -
 46
46 -
 47
47 -
 48
48 -
 49
49 -
 50
50 -
 51
51 -
 52
52 -
 53
53 -
 54
54 -
 55
55 -
56
-
57
-
58
-
59
-
60
-
61
-
62
-
63
-
64
-
65
-
66
-
67
-
68
-
69
-
70
-
71
-
72
-
73
-
74
-
75
-
76
-
77
-
78
-
79
-
80
-
81
-
82
-
83
-
84
-
85
-
86
-
87
-
88
-
89
-
90
-
91
-
92
-
93
-
94
 |
 |

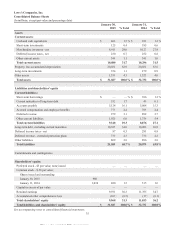
Lowe's Companies, Inc.
Consolidated Balance Sheets
(In millions, except par value and percentage data)
January 30,
2015 % Total
January 31,
2014 % Total
Assets
Current assets:
Cash and cash equivalents $ 466
1.5 % $ 391
1.2 %
Short-term investments 125
0.4
185
0.6
Merchandise inventory - net 8,911
28.0
9,127
27.9
Deferred income taxes - net 230
0.7
252
0.8
Other current assets 348
1.1
341
1.0
Total current assets
10,080
31.7
10,296
31.5
Property, less accumulated depreciation 20,034
62.9
20,834
63.6
Long-term investments 354
1.1
279
0.9
Other assets 1,359
4.3
1,323
4.0
Total assets
$ 31,827
100.0 % $ 32,732
100.0 %
Liabilities and shareholders' equity
Current liabilities:
Short-term borrowings $
—
—
% $ 386
1.2 %
Current maturities of long-term debt 552
1.7
49
0.1
Accounts payable 5,124
16.1
5,008
15.3
Accrued compensation and employee benefits 773
2.4
785
2.4
Deferred revenue 979
3.1
892
2.7
Other current liabilities 1,920
6.0
1,756
5.4
Total current liabilities 9,348
29.3
8,876
27.1
Long-term debt, excluding current maturities 10,815
34.0
10,086
30.8
Deferred income taxes - net 97
0.3
291
0.9
Deferred revenue - extended protection plans 730
2.3
730
2.2
Other liabilities 869
2.8
896
2.8
Total liabilities 21,859
68.7 % 20,879
63.8 %
Commitments and contingencies
Shareholders' equity:
Preferred stock - $5 par value, none issued
—
—
—
—
Common stock - $.50 par value;
Shares issued and outstanding
January 30, 2015 960
January 31, 2014 1,030 480
1.5
515
1.6
Capital in excess of par value
—
—
—
—
Retained earnings 9,591
30.3
11,355
34.7
Accumulated other comprehensive loss (103 ) (0.5 ) (17 ) (0.1 )
Total shareholders' equity 9,968
31.3
11,853
36.2
Total liabilities and shareholders' equity
$ 31,827
100.0 % $ 32,732
100.0 %
See accompanying notes to consolidated financial statements.
35
This proof is printed at 96% of original size
This line represents final trim and will not print