Lowe's 2014 Annual Report Download - page 47
Download and view the complete annual report
Please find page 47 of the 2014 Lowe's annual report below. You can navigate through the pages in the report by either clicking on the pages listed below, or by using the keyword search tool below to find specific information within the annual report.-
 1
1 -
2
-
3
-
4
-
5
-
6
-
7
-
8
-
9
-
10
-
11
-
12
-
13
-
14
-
15
-
16
-
17
-
18
-
19
-
20
-
21
-
22
-
23
-
24
-
25
-
26
-
27
-
28
-
29
-
30
-
31
-
32
-
33
-
34
-
35
-
36
-
 37
37 -
 38
38 -
 39
39 -
 40
40 -
 41
41 -
 42
42 -
 43
43 -
 44
44 -
 45
45 -
 46
46 -
 47
47 -
 48
48 -
 49
49 -
 50
50 -
 51
51 -
 52
52 -
 53
53 -
 54
54 -
 55
55 -
 56
56 -
 57
57 -
58
-
59
-
60
-
61
-
62
-
63
-
64
-
65
-
66
-
67
-
68
-
69
-
70
-
71
-
72
-
73
-
74
-
75
-
76
-
77
-
78
-
79
-
80
-
81
-
82
-
83
-
84
-
85
-
86
-
87
-
88
-
89
-
90
-
91
-
92
-
93
-
94
 |
 |

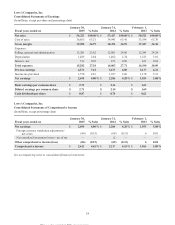
Lowe's Companies, Inc.
Consolidated Statements of Cash Flows
(In millions)
Fiscal years ended on January 30,
2015 January 31,
2014 February 1,
2013
Cash flows from operating activities:
Net earnings $ 2,698
$ 2,286
$ 1,959
Adjustments to reconcile net earnings to net cash provided by operating
activities:
Depreciation and amortization 1,586
1,562
1,623
Deferred income taxes (124 ) (162 ) (140)
Loss on property and other assets – net 25
64
83
Loss on equity method investments 57
52
48
Share-based payment expense 119
100
100
Changes in operating assets and liabilities:
Merchandise inventory – net 170
(396 ) (244)
Other operating assets 83
(5 ) (87)
Accounts payable 127
291
303
Other operating liabilities 188
319
117
Net cash provided by operating activities 4,929
4,111
3,762
Cash flows from investing activities:
Purchases of investments (820 ) (759 ) (1,444)
Proceeds from sale/maturity of investments 805
709
1,837
Capital expenditures (880 ) (940 ) (1,211)
Contributions to equity method investments – net (241 ) (173 ) (219)
Proceeds from sale of property and other long-term assets 52
75
130
Acquisition of business - net
—
(203 )
—
Other – net (4 ) 5
4
Net cash used in investing activities (1,088 )
(1,286 ) (903)
Cash flows from financing activities:
Net change in short-term borrowings (386 ) 386
—
Net proceeds from issuance of long-term debt 1,239
985
1,984
Repayment of long-term debt (48 ) (47 ) (591)
Proceeds from issuance of common stock under share-based payment plans 137
165
349
Cash dividend payments (822 ) (733 ) (704)
Repurchase of common stock (3,905 ) (3,710 ) (4,393)
Other – net 24
(15 ) 22
Net cash used in financing activities (3,761 )
(2,969 ) (3,333)
Effect of exchange rate changes on cash (5 )
(6 ) 1
Net increase/(decrease) in cash and cash equivalents 75
(150 ) (473)
Cash and cash equivalents, beginning of year 391
541
1,014
Cash and cash equivalents, end of year $ 466
$ 391
$ 541
See accompanying notes to consolidated financial statements.
37
This proof is printed at 96% of original size
This line represents final trim and will not print