McDonalds 2009 Annual Report Download - page 10
Download and view the complete annual report
Please find page 10 of the 2009 McDonalds annual report below. You can navigate through the pages in the report by either clicking on the pages listed below, or by using the keyword search tool below to find specific information within the annual report.-
 1
1 -
 2
2 -
 3
3 -
 4
4 -
 5
5 -
 6
6 -
 7
7 -
 8
8 -
 9
9 -
 10
10 -
 11
11 -
 12
12 -
 13
13 -
 14
14 -
 15
15 -
 16
16 -
 17
17 -
 18
18 -
 19
19 -
 20
20 -
 21
21 -
22
-
23
-
24
-
25
-
26
-
27
-
28
-
29
-
30
-
31
-
32
-
33
-
34
-
35
-
36
-
37
-
38
-
39
-
40
-
41
-
42
-
43
-
44
-
45
-
46
-
47
-
48
-
49
-
50
-
51
-
52
-
53
-
54
-
55
-
56
 |
 |

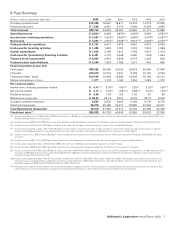
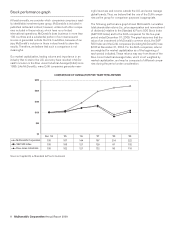
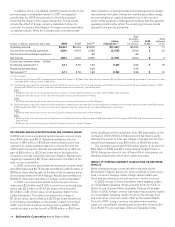
Stock performance graph
At least annually, we consider which companies comprise a read-
ily identifiable investment peer group. McDonald’s is included in
published restaurant indices; however, unlike most other compa-
nies included in these indices, which have no or limited
international operations, McDonald’s does business in more than
100 countries and a substantial portion of our revenues and
income is generated outside the U.S. In addition, because of our
size, McDonald’s inclusion in those indices tends to skew the
results. Therefore, we believe that such a comparison is not
meaningful.
Our market capitalization, trading volume and importance in an
industry that is vital to the U.S. economy have resulted in McDo-
nald’s inclusion in the Dow Jones Industrial Average (DJIA) since
1985. Like McDonald’s, many DJIA companies generate mean-
ingful revenues and income outside the U.S. and some manage
global brands. Thus, we believe that the use of the DJIA compa-
nies as the group for comparison purposes is appropriate.
The following performance graph shows McDonald’s cumulative
total shareholder returns (i.e., price appreciation and reinvestment
of dividends) relative to the Standard & Poor’s 500 Stock Index
(S&P 500 Index) and to the DJIA companies for the five-year
period ended December 31, 2009. The graph assumes that the
value of an investment in McDonald’s common stock, the S&P
500 Index and the DJIA companies (including McDonald’s) was
$100 at December 31, 2004. For the DJIA companies, returns
are weighted for market capitalization as of the beginning of
each period indicated. These returns may vary from those of the
Dow Jones Industrial Average Index, which is not weighted by
market capitalization, and may be composed of different compa-
nies during the period under consideration.
COMPARISON OF CUMULATIVE FIVE YEAR TOTAL RETURN
Dec '04 '05 '06 '07 '09'08
McDonald's Corporation
S&P 500 Index
Dow Jones Industrials
$0
$50
$100
$150
$200
$250
100 107 144 197 214 222
100 105 121 128 81 102
100 102 121 132 90 110
Source: Capital IQ, a Standard & Poor’s business
8McDonald’s Corporation Annual Report 2009