McDonalds 2009 Annual Report Download - page 17
Download and view the complete annual report
Please find page 17 of the 2009 McDonalds annual report below. You can navigate through the pages in the report by either clicking on the pages listed below, or by using the keyword search tool below to find specific information within the annual report.-
 1
1 -
2
-
3
-
4
-
5
-
6
-
 7
7 -
 8
8 -
 9
9 -
 10
10 -
 11
11 -
 12
12 -
 13
13 -
 14
14 -
 15
15 -
 16
16 -
 17
17 -
 18
18 -
 19
19 -
 20
20 -
 21
21 -
 22
22 -
 23
23 -
 24
24 -
 25
25 -
 26
26 -
 27
27 -
28
-
29
-
30
-
31
-
32
-
33
-
34
-
35
-
36
-
37
-
38
-
39
-
40
-
41
-
42
-
43
-
44
-
45
-
46
-
47
-
48
-
49
-
50
-
51
-
52
-
53
-
54
-
55
-
56
 |
 |

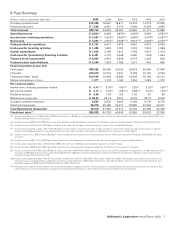
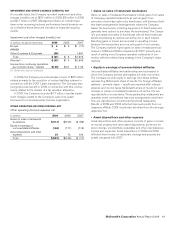
Impact of foreign currency translation on reported results
Reported amount Currency translation benefit/(cost)
In millions, except per share data 2009 2008 2007 2009 2008 2007
Revenues $22,745 $23,522 $22,787 $(1,340) $441 $988
Company-operated margins 2,807 2,908 2,869 (178) 63 129
Franchised margins 5,985 5,731 5,036 (176) 120 179
Selling, general & administrative expenses 2,234 2,355 2,367 75 (21) (73)
Operating income 6,841 6,443 3,879 (273) 163 230
Income from continuing operations 4,551 4,313 2,335 (164) 103 138
Net income 4,551 4,313 2,395 (164) 103 138
Income from continuing operations per common
share—diluted 4.11 3.76 1.93 (.15) .09 .12
Net income per common share—diluted 4.11 3.76 1.98 (.15) .09 .12
REVENUES
The Company’s revenues consist of sales by Company-operated
restaurants and fees from restaurants operated by franchisees.
Revenues from conventional franchised restaurants include rent
and royalties based on a percent of sales along with minimum
rent payments, and initial fees. Revenues from franchised restau-
rants that are licensed to affiliates and developmental licensees
include a royalty based on a percent of sales, and generally
include initial fees.
The Company continues to optimize its restaurant ownership
mix, cash flow and returns through its refranchising strategy. For
the full years 2008 and 2009 combined, the Company refran-
chised about 1,100 restaurants, primarily in its major markets.
The shift to a greater percentage of franchised restaurants neg-
atively impacts consolidated revenues as Company-operated
sales shift to franchised sales, where the Company receives rent
and/or royalties based on a percent of sales.
In 2009, constant currency revenue growth was driven by
positive comparable sales and expansion, partly offset by the
impact of the refranchising strategy in certain of the Company’s
major markets. As a result of the refranchising strategy, fran-
chised restaurants represent 81%, 80% and 78% of Systemwide
restaurants at December 31, 2009, 2008 and 2007, respectively.
In 2008, constant currency revenue growth was driven by
positive comparable sales, partly offset by the refranchising
strategy and the impact of the Latam transaction. Upon com-
pletion of the Latam transaction in August 2007, the Company
receives royalties based on a percent of sales in these markets
instead of a combination of Company-operated sales and fran-
chised rents and royalties.
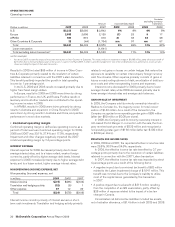
Revenues
Amount Increase/(decrease)
Increase/(decrease)
excluding currency
translation
Dollars in millions 2009 2008 2007 2009 2008 2009 2008
Company-operated sales:
U.S. $ 4,295 $ 4,636 $ 4,682 (7)% (1)% (7)% (1)%
Europe 6,721 7,424 6,817 (9) 936
APMEA 3,714 3,660 3,134 117 514
Other Countries & Corporate 729 841 1,978 (13) (57) (7) (58)
Total $15,459 $16,561 $16,611 (7)% —% —% (2)%
Franchised revenues:
U.S. $ 3,649 $ 3,442 $ 3,224 6% 7% 6% 7%
Europe 2,553 2,499 2,109 218 10 13
APMEA 623 571 465 923 12 20
Other Countries & Corporate 461 449 378 319 917
Total $ 7,286 $ 6,961 $ 6,176 5% 13 % 8% 10 %
Total revenues:
U.S. $ 7,944 $ 8,078 $ 7,906 (2)% 2% (2)% 2%
Europe 9,274 9,923 8,926 (7) 11 57
APMEA 4,337 4,231 3,599 318 615
Other Countries & Corporate 1,190 1,290 2,356 (8) (45) (2) (46)
Total $22,745 $23,522 $22,787 (3)% 3% 2% 1%
McDonald’s Corporation Annual Report 2009 15