McDonalds 2009 Annual Report Download - page 18
Download and view the complete annual report
Please find page 18 of the 2009 McDonalds annual report below. You can navigate through the pages in the report by either clicking on the pages listed below, or by using the keyword search tool below to find specific information within the annual report.-
 1
1 -
2
-
3
-
4
-
5
-
6
-
7
-
 8
8 -
 9
9 -
 10
10 -
 11
11 -
 12
12 -
 13
13 -
 14
14 -
 15
15 -
 16
16 -
 17
17 -
 18
18 -
 19
19 -
 20
20 -
 21
21 -
 22
22 -
 23
23 -
 24
24 -
 25
25 -
 26
26 -
 27
27 -
 28
28 -
29
-
30
-
31
-
32
-
33
-
34
-
35
-
36
-
37
-
38
-
39
-
40
-
41
-
42
-
43
-
44
-
45
-
46
-
47
-
48
-
49
-
50
-
51
-
52
-
53
-
54
-
55
-
56
 |
 |

In the U.S., revenues in 2009 and 2008 were positively
impacted by the ongoing appeal of our iconic core products and
the success of new products, as well as continued focus on
everyday value and convenience. In addition, our market-leading
breakfast business contributed to revenue growth in 2008. New
products introduced in 2009 included McCafé premium coffees
and the Angus Third Pounder, while new products introduced in
2008 included Southern Style Chicken products, Iced Coffee and
Sweet Tea. The refranchising strategy negatively impacted rev-
enue growth in both years.
Europe’s constant currency increases in revenues in 2009
and 2008 were primarily driven by comparable sales increases in
the U.K., France and Russia (which is entirely Company-
operated) as well as expansion in Russia. In both years, these
increases were partly offset by the impact of the refranchising
strategy, primarily in the U.K. and Germany.
In APMEA, the constant currency increase in revenues in
2009 was primarily driven by comparable sales increases in
Australia and most other Asian markets, partly offset by negative
comparable sales in China. The 2008 increase was primarily
driven by strong comparable sales in Australia and China, as well
as positive comparable sales throughout the segment. In addition,
expansion in China contributed to the increases in both years.
In Other Countries & Corporate, Company-operated sales
declined in 2008 while franchised revenues increased primarily
as a result of the Latam transaction in August 2007. Revenues in
both years were negatively impacted by the refranchising strat-
egy in Canada.
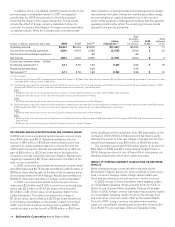
The following tables present Systemwide sales and com-
parable sales increases/(decreases):
Systemwide sales increases/(decreases)
Excluding currency
translation
2009 2008 2009 2008
U.S. 3% 5% 3% 5%
Europe (2) 15 710
APMEA 819 712
Other Countries &
Corporate —16 714
Total 2% 11% 6% 9%
Comparable sales increases
2009 2008 2007
U.S. 2.6% 4.0% 4.5%
Europe 5.2 8.5 7.6
APMEA 3.4 9.0 10.6
Other Countries & Corporate 5.5 13.0 10.8
Total 3.8% 6.9% 6.8%
RESTAURANT MARGINS
• Franchised margins
Franchised margin dollars represent revenues from franchised
restaurants less the Company’s occupancy costs (rent and
depreciation) associated with those sites. Franchised margin
dollars represented nearly 70% of the combined restaurant mar-
gins in 2009 and about 65% of the combined restaurant margins
in 2008 and 2007. Franchised margin dollars increased
$254 million or 4% (7% in constant currencies) in 2009 and
$695 million or 14% (11% in constant currencies) in 2008. The
refranchising strategy contributed to the growth in franchised
margin dollars in both 2009 and 2008 and the August 2007
Latam transaction contributed to the growth in 2008.
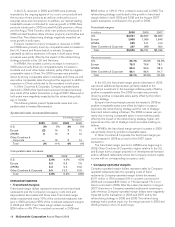
Franchised margins
In millions 2009 2008 2007
U.S. $3,031 $2,867 $2,669
Europe 1,998 1,965 1,648
APMEA 559 511 410
Other Countries & Corporate 397 388 309
Total $5,985 $5,731 $5,036
Percent of revenues
U.S. 83.1% 83.3% 82.8%
Europe 78.3 78.6 78.1
APMEA 89.6 89.6 88.3
Other Countries & Corporate 86.1 86.4 81.7
Total 82.1% 82.3% 81.5%
In the U.S., the franchised margin percent decrease in 2009
was due to additional depreciation primarily related to the
Company’s investment in the beverage initiative, partly offset by
positive comparable sales. The 2008 increase was primarily
driven by positive comparable sales, partly offset by the refran-
chising strategy.
Europe’s franchised margin percent decreased in 2009 as
positive comparable sales were offset by higher occupancy
expenses, the refranchising strategy and the cost of strategic
brand and sales building initiatives. The 2008 increase was pri-
marily due to strong comparable sales in most markets, partly
offset by the impact of the refranchising strategy, higher rent
expense and the cost of strategic brand and sales building ini-
tiatives.
In APMEA, the franchised margin percent increase in 2008
was primarily driven by positive comparable sales.
In Other Countries & Corporate, the franchised margin per-
cent increased in 2008 as a result of the 2007 Latam
transaction.
The franchised margin percent in APMEA and, beginning in
2008, Other Countries & Corporate is higher relative to the U.S.
and Europe due to a larger proportion of developmental licensed
and/or affiliated restaurants where the Company receives royalty
income with no corresponding occupancy costs.
• Company-operated margins
Company-operated margin dollars represent sales by Company-
operated restaurants less the operating costs of these
restaurants. Company-operated margin dollars decreased
$101 million or 3% (increased 3% in constant currencies) in
2009 and increased $39 million or 1% (decreased 1% in con-
stant currencies) in 2008. After the Latam transaction in August
2007, there are no Company-operated restaurants remaining in
Latin America. Company-operated margin dollars were negatively
impacted by this transaction in 2008 and 2007 and by the
refranchising strategy in 2009 and 2008. The refranchising
strategy had a positive impact on the margin percent in 2009 and
2008, primarily in the U.S. and Europe.
16 McDonald’s Corporation Annual Report 2009