McDonalds 2009 Annual Report Download - page 42
Download and view the complete annual report
Please find page 42 of the 2009 McDonalds annual report below. You can navigate through the pages in the report by either clicking on the pages listed below, or by using the keyword search tool below to find specific information within the annual report.-
 1
1 -
2
-
3
-
4
-
5
-
6
-
7
-
8
-
9
-
10
-
11
-
12
-
13
-
14
-
15
-
16
-
17
-
18
-
19
-
20
-
21
-
22
-
23
-
24
-
25
-
26
-
27
-
28
-
29
-
30
-
31
-
 32
32 -
 33
33 -
 34
34 -
 35
35 -
 36
36 -
 37
37 -
 38
38 -
 39
39 -
 40
40 -
 41
41 -
 42
42 -
 43
43 -
 44
44 -
 45
45 -
 46
46 -
 47
47 -
 48
48 -
 49
49 -
 50
50 -
 51
51 -
 52
52 -
53
-
54
-
55
-
56
 |
 |

and developmental licensees operating under license agree-
ments pay a royalty to the Company based upon a percent of
sales, and may pay initial fees.
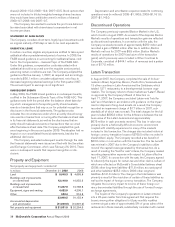
The results of operations of restaurant businesses purchased
and sold in transactions with franchisees were not material to the
consolidated financial statements for periods prior to purchase
and sale.
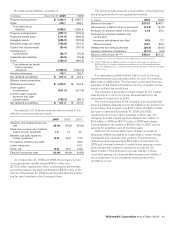
Revenues from franchised restaurants consisted of:
In millions 2009 2008 2007
Rents $4,841.0 $4,612.8 $4,177.2
Royalties 2,379.8 2,275.7 1,941.1
Initial fees 65.4 73.0 57.3
Revenues from
franchised restaurants $7,286.2 $6,961.5 $6,175.6
Future minimum rent payments due to the Company under
existing franchise arrangements are:
In millions Owned sites Leased sites Total
2010 $ 1,218.1 $ 1,076.0 $ 2,294.1
2011 1,177.3 1,042.9 2,220.2
2012 1,144.5 1,011.5 2,156.0
2013 1,105.1 972.4 2,077.5
2014 1,062.1 924.8 1,986.9
Thereafter 8,495.8 6,782.5 15,278.3
Total minimum
payments $14,202.9 $11,810.1 $26,013.0
At December 31, 2009, net property and equipment under
franchise arrangements totaled $13.1 billion (including land of
$3.8 billion) after deducting accumulated depreciation and amor-
tization of $6.5 billion.
Leasing Arrangements
At December 31, 2009, the Company was the lessee at 13,858
restaurant locations through ground leases (the Company leases
the land and the Company or franchisee owns the building) and
through improved leases (the Company leases land and
buildings). Lease terms for most restaurants are generally for 20
years and, in many cases, provide for rent escalations and
renewal options, with certain leases providing purchase options.
Escalation terms vary by geographic segment with examples
including fixed-rent escalations, escalations based on an inflation
index, and fair-value market adjustments. The timing of these
escalations generally ranges from annually to every five years.
For most locations, the Company is obligated for the related
occupancy costs including property taxes, insurance and main-
tenance; however, for franchised sites, the Company requires the
franchisees to pay these costs. In addition, the Company is the
lessee under noncancelable leases covering certain offices and
vehicles.
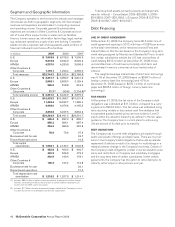
Future minimum payments required under existing operating
leases with initial terms of one year or more are:
In millions Restaurant Other Total
2010 $ 1,064.7 $ 54.7 $ 1,119.4
2011 1,002.4 44.1 1,046.5
2012 928.1 35.3 963.4
2013 859.8 25.6 885.4
2014 783.9 22.0 805.9
Thereafter 5,794.5 102.4 5,896.9
Total minimum
payments $10,433.4 $284.1 $10,717.5
The following table provides detail of rent expense:
In millions 2009 2008 2007
Company-operated
restaurants:
U.S. $ 65.2 $ 73.7 $ 82.0
Outside the U.S. 506.9 532.0 533.9
Total 572.1 605.7 615.9
Franchised restaurants:
U.S. 393.9 374.7 358.4
Outside the U.S. 431.4 409.4 364.5
Total 825.3 784.1 722.9
Other 98.9 101.8 98.5
Total rent expense $1,496.3 $1,491.6 $1,437.3
Rent expense included percent rents in excess of minimum
rents (in millions) as follows–Company-operated restaurants:
2009–$129.6; 2008–$130.2; 2007–$118.3. Franchised
restaurants: 2009–$154.7; 2008–$143.5; 2007–$136.1.
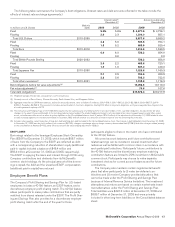
Income Taxes
Income from continuing operations before provision for income
taxes, classified by source of income, was as follows:
In millions 2009 2008 2007
U.S. $2,700.4 $2,769.4 $2,455.0
Outside the U.S. 3,786.6 3,388.6 1,117.1
Income from continuing
operations before provision
for income taxes $6,487.0 $6,158.0 $3,572.1
The provision for income taxes, classified by the timing and
location of payment, was as follows:
In millions 2009 2008 2007
U.S. federal $ 792.0 $ 808.4 $ 480.8
U.S. state 152.1 134.7 84.9
Outside the U.S. 788.9 800.2 710.5
Current tax provision 1,733.0 1,743.3 1,276.2
U.S. federal 186.9 75.6 (14.3)
U.S. state 8.6 28.7 10.0
Outside the U.S. 7.5 (2.8) (34.8)
Deferred tax provision
(benefit) 203.0 101.5 (39.1)
Provision for income taxes $1,936.0 $1,844.8 $1,237.1
40 McDonald’s Corporation Annual Report 2009