McDonalds 2009 Annual Report Download - page 20
Download and view the complete annual report
Please find page 20 of the 2009 McDonalds annual report below. You can navigate through the pages in the report by either clicking on the pages listed below, or by using the keyword search tool below to find specific information within the annual report.-
 1
1 -
2
-
3
-
4
-
5
-
6
-
7
-
8
-
9
-
 10
10 -
 11
11 -
 12
12 -
 13
13 -
 14
14 -
 15
15 -
 16
16 -
 17
17 -
 18
18 -
 19
19 -
 20
20 -
 21
21 -
 22
22 -
 23
23 -
 24
24 -
 25
25 -
 26
26 -
 27
27 -
 28
28 -
 29
29 -
 30
30 -
31
-
32
-
33
-
34
-
35
-
36
-
37
-
38
-
39
-
40
-
41
-
42
-
43
-
44
-
45
-
46
-
47
-
48
-
49
-
50
-
51
-
52
-
53
-
54
-
55
-
56
 |
 |

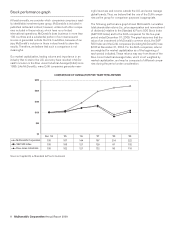
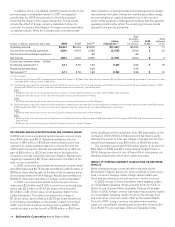
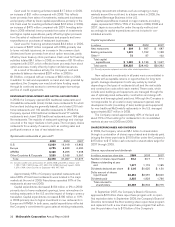
While we believe that the following information provides a perspective in evaluating our Company-operated business, it is not
intended as a measure of our operating performance or as an alternative to operating income or restaurant margins as reported by the
Company in accordance with accounting principles generally accepted in the U.S. In particular, as noted previously, we do not allocate
selling, general & administrative expenses to our Company-operated business. However, we believe that a range of $40,000 to $50,000
per restaurant, on average, is a typical range of costs to support this business in the U.S. The actual costs in markets outside the U.S. will
vary depending on local circumstances and the organizational structure of the market. These costs reflect the indirect services we believe
are necessary to provide the appropriate support of the restaurant.
U.S. Europe
Dollars in millions 2009 2008 2007 2009 2008 2007
As reported
Number of Company-operated restaurants at year end 1,578 1,782 2,090 2,001 2,024 2,177
Sales by Company-operated restaurants $4,295 $4,636 $4,682 $ 6,721 $ 7,424 $ 6,817
Company-operated margin $ 832 $ 856 $ 876 $ 1,240 $ 1,340 $ 1,205
Store operating margin
Company-operated margin $ 832 $ 856 $ 876 $ 1,240 $ 1,340 $ 1,205
Plus:
Outside rent expense(1) 65 74 82 222 254 248
Depreciation – buildings & leasehold
improvements(1) 70 70 78 100 110 107
Less:
Rent & royalties(2) (634) (684) (691) (1,306) (1,435) (1,294)
Store operating margin $ 333 $ 316 $ 345 $ 256 $ 269 $ 266
Brand/real estate margin
Rent & royalties(2) $ 634 $ 684 $ 691 $ 1,306 $ 1,435 $ 1,294
Less:
Outside rent expense(1) (65) (74) (82) (222) (254) (248)
Depreciation – buildings & leasehold
improvements(1) (70) (70) (78) (100) (110) (107)
Brand/real estate margin $ 499 $ 540 $ 531 $ 984 $ 1,071 $ 939
(1) Represents certain costs recorded as occupancy & other operating expenses in the Consolidated statement of income – rent payable by McDonald’s to third parties on leased sites and
depreciation for buildings and leasehold improvements. This adjustment is made to reflect these occupancy costs in Brand/real estate margin. The relative percentage of sites that are
owned versus leased varies by country.
(2) Reflects average Company–operated rent and royalties (as a percentage of 2009 sales: U.S. – 14.8% and Europe – 19.4%). This adjustment is made to reflect expense in Store
operating margin and income in Brand/real estate margin. Countries within Europe have varying economic profiles and a wide range of rent and royalty rates as a percentage of sales.
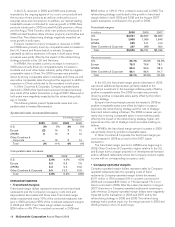
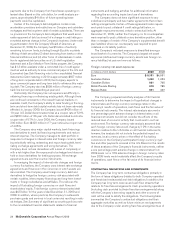
SELLING, GENERAL & ADMINISTRATIVE EXPENSES
Consolidated selling, general & administrative expenses decreased 5% (2% in constant currencies) in 2009 and were flat (decreased
1% in constant currencies) in 2008. In 2008, expenses included costs related to the Beijing Summer Olympics and the Company’s bien-
nial Worldwide Owner/Operator Convention. The 2008 constant currency change benefited by 3 percentage points due to the 2007
Latam transaction.
Selling, general & administrative expenses
Amount Increase/(decrease)
Increase/(decrease)
excluding currency
translation
Dollars in millions 2009 2008 2007 2009 2008 2009 2008
U.S. $ 751 $ 745 $ 744 1% —% 1% —%
Europe 655 714 689 (8) 4—1
APMEA 276 300 276 (8) 9(5) 8
Other Countries & Corporate(1) 552 596 658 (7) (9) (7) (9)
Total $2,234 $2,355 $2,367 (5)% —% (2)% (1)%
(1) Included in Other Countries & Corporate are home office support costs in areas such as facilities, finance, human resources, information technology, legal, marketing, restaurant oper-
ations, supply chain and training.
Selling, general & administrative expenses as a percent of revenues were 9.8% in 2009 compared with 10.0% in 2008 and 10.4% in
2007. Selling, general & administrative expenses as a percent of Systemwide sales were 3.1% in 2009 compared with 3.3% in 2008
and 3.7% in 2007. Management believes that analyzing selling, general & administrative expenses as a percent of Systemwide sales, as
well as revenues, is meaningful because these costs are incurred to support Systemwide restaurants.
18 McDonald’s Corporation Annual Report 2009