McDonalds 2009 Annual Report Download - page 24
Download and view the complete annual report
Please find page 24 of the 2009 McDonalds annual report below. You can navigate through the pages in the report by either clicking on the pages listed below, or by using the keyword search tool below to find specific information within the annual report.-
 1
1 -
2
-
3
-
4
-
5
-
6
-
7
-
8
-
9
-
10
-
11
-
12
-
13
-
 14
14 -
 15
15 -
 16
16 -
 17
17 -
 18
18 -
 19
19 -
 20
20 -
 21
21 -
 22
22 -
 23
23 -
 24
24 -
 25
25 -
 26
26 -
 27
27 -
 28
28 -
 29
29 -
 30
30 -
 31
31 -
 32
32 -
 33
33 -
 34
34 -
35
-
36
-
37
-
38
-
39
-
40
-
41
-
42
-
43
-
44
-
45
-
46
-
47
-
48
-
49
-
50
-
51
-
52
-
53
-
54
-
55
-
56
 |
 |

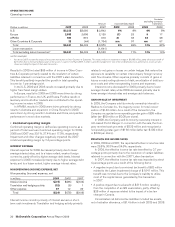
Cash used for investing activities totaled $1.7 billion in 2009,
an increase of $31 million compared with 2008. This reflects
lower proceeds from sales of investments, restaurant businesses
and property, offset by lower capital expenditures, primarily in the
U.S. Cash used for investing activities totaled $1.6 billion in 2008,
an increase of $475 million compared with 2007. Investing activ-
ities in 2008 reflected lower proceeds from sales of investments
and higher capital expenditures, partly offset by higher proceeds
from the sales of restaurant businesses and property and lower
expenditures on purchases of restaurant businesses.
Cash used for financing activities totaled $4.4 billion in 2009,
an increase of $307 million compared with 2008, primarily due
to lower net debt issuances, an increase in the common stock
dividend and lower proceeds from stock option exercises, partly
offset by lower treasury stock purchases. Cash used for financing
activities totaled $4.1 billion in 2008, an increase of $118 million
compared with 2007, which reflected lower proceeds from stock
option exercises, mostly offset by higher net debt issuances.
As a result of the above activity, the Company’s cash and
equivalents balance decreased $267 million in 2009 to
$1.8 billion, compared with an increase of $82 million in 2008.
In addition to cash and equivalents on hand and cash provided by
operations, the Company can meet short-term funding needs
through its continued access to commercial paper borrowings
and line of credit agreements.
RESTAURANT DEVELOPMENT AND CAPITAL EXPENDITURES
In 2009, the Company opened 824 traditional restaurants and
44 satellite restaurants (small, limited-menu restaurants for which
the land and building are generally leased), and closed 215 tradi-
tional restaurants and 142 satellite restaurants. In 2008, the
Company opened 918 traditional restaurants and 77 satellite
restaurants and closed 209 traditional restaurants and 196 satel-
lite restaurants. The majority of restaurant openings and closings
occurred in the major markets in both years. The Company closes
restaurants for a variety of reasons, such as existing sales and
profit performance or loss of real estate tenure.
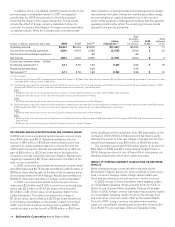
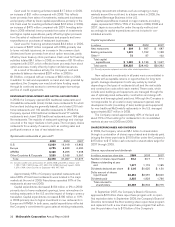
Systemwide restaurants at year end(1)
2009 2008 2007
U.S. 13,980 13,918 13,862
Europe 6,785 6,628 6,480
APMEA 8,488 8,255 7,938
Other Countries & Corporate 3,225 3,166 3,097
Total 32,478 31,967 31,377
(1) Includes satellite units at December 31, 2009, 2008 and 2007 as follows: U.S.–
1,155, 1,169, 1,233; Europe–241, 226, 214; APMEA (primarily Japan)–1,263,
1,379, 1,454; Other Countries & Corporate–464, 447, 439.
Approximately 65% of Company-operated restaurants and
about 80% of franchised restaurants were located in the major
markets at the end of 2009. Franchisees operated 81% of the
restaurants at year-end 2009.
Capital expenditures decreased $184 million or 9% in 2009
primarily due to fewer restaurant openings, lower reinvestment in
existing restaurants in the U.S. and the impact of foreign currency
translation. Capital expenditures increased $189 million or 10%
in 2008 primarily due to higher investment in new restaurants in
Europe and APMEA. In both years, capital expenditures reflected
the Company’s commitment to grow sales at existing restaurants,
including reinvestment initiatives such as reimaging in many
markets around the world and, to a lesser extent in 2009, the
Combined Beverage Business in the U.S.
Capital expenditures invested in major markets, excluding
Japan, represented 70% to 75% of the total in 2009, 2008 and
2007. Japan is accounted for under the equity method, and
accordingly its capital expenditures are not included in con-
solidated amounts.
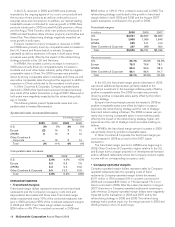
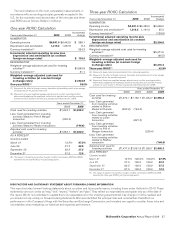
Capital expenditures
In millions 2009 2008 2007
New restaurants $ 809 $ 897 $ 687
Existing restaurants 1,070 1,152 1,158
Other(1) 73 87 102
Total capital
expenditures $ 1,952 $ 2,136 $ 1,947
Total assets $30,225 $28,462 $29,392
(1) Primarily corporate equipment and other office related expenditures.
New restaurant investments in all years were concentrated in
markets with acceptable returns or opportunities for long-term
growth. Average development costs vary widely by market
depending on the types of restaurants built and the real estate
and construction costs within each market. These costs, which
include land, buildings and equipment, are managed through the
use of optimally sized restaurants, construction and design effi-
ciencies and leveraging best practices. Although the Company is
not responsible for all costs for every restaurant opened, total
development costs (consisting of land, buildings and equipment)
for new traditional McDonald’s restaurants in the U.S. averaged
approximately $2.7 million in 2009.
The Company owned approximately 45% of the land and
about 70% of the buildings for restaurants in its consolidated
markets at year-end 2009 and 2008.
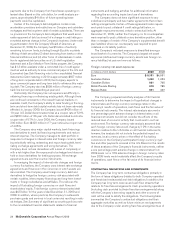
SHARE REPURCHASES AND DIVIDENDS
In 2009, the Company returned $5.1 billion to shareholders
through a combination of shares repurchased and dividends paid,
bringing the three-year total to $16.6 billion under the Company’s
$15 billion to $17 billion cash returned to shareholders target for
2007 through 2009.
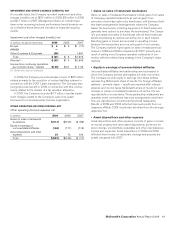
Shares repurchased and dividends
In millions, except per share data 2009 2008 2007
Number of shares repurchased 50.3 69.7 77.1
Shares outstanding at year
end 1,077 1,115 1,165
Dividends declared per share $ 2.05 $1.625 $ 1.50
Dollar amount of shares
repurchased $2,854 $3,981 $3,949
Dividends paid 2,235 1,823 1,766
Total returned to
shareholders $5,089 $5,804 $5,715
In September 2007, the Company’s Board of Directors
approved a $10 billion share repurchase program with no speci-
fied expiration date. In September 2009, the Company’s Board of
Directors terminated the then-existing share repurchase program
and replaced it with a new share repurchase program that author-
izes the purchase of up to $10 billion of the Company’s
22 McDonald’s Corporation Annual Report 2009