McDonalds 2009 Annual Report Download - page 44
Download and view the complete annual report
Please find page 44 of the 2009 McDonalds annual report below. You can navigate through the pages in the report by either clicking on the pages listed below, or by using the keyword search tool below to find specific information within the annual report.-
 1
1 -
2
-
3
-
4
-
5
-
6
-
7
-
8
-
9
-
10
-
11
-
12
-
13
-
14
-
15
-
16
-
17
-
18
-
19
-
20
-
21
-
22
-
23
-
24
-
25
-
26
-
27
-
28
-
29
-
30
-
31
-
32
-
33
-
 34
34 -
 35
35 -
 36
36 -
 37
37 -
 38
38 -
 39
39 -
 40
40 -
 41
41 -
 42
42 -
 43
43 -
 44
44 -
 45
45 -
 46
46 -
 47
47 -
 48
48 -
 49
49 -
 50
50 -
 51
51 -
 52
52 -
 53
53 -
 54
54 -
55
-
56
 |
 |

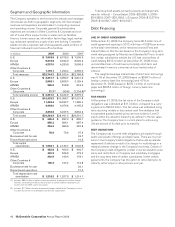
Segment and Geographic Information
The Company operates in the food service industry and manages
its business as distinct geographic segments. All intercompany
revenues and expenses are eliminated in computing revenues
and operating income. Corporate general & administrative
expenses are included in Other Countries & Corporate and con-
sist of home office support costs in areas such as facilities,
finance, human resources, information technology, legal, market-
ing, restaurant operations, supply chain and training. Corporate
assets include corporate cash and equivalents, asset portions of
financial instruments and home office facilities.
In millions 2009 2008 2007
U.S. $ 7,943.8 $ 8,078.3 $ 7,905.5
Europe 9,273.8 9,922.9 8,926.2
APMEA 4,337.0 4,230.8 3,598.9
Other Countries &
Corporate 1,190.1 1,290.4 2,356.0
Total revenues $22,744.7 $23,522.4 $22,786.6
U.S. $ 3,231.7 $ 3,059.7 $ 2,841.9
Europe 2,588.1 2,608.0 2,125.4
APMEA 989.5 818.8 616.3
Other Countries &
Corporate 31.7(1) (43.6) (1,704.6)(2)
Total operating income $ 6,841.0 $ 6,442.9 $ 3,879.0
U.S. $10,429.3 $10,356.7 $10,031.8
Europe 11,494.4 10,532.7 11,380.4
APMEA 4,409.0 4,074.6 4,145.3
Other Countries &
Corporate 3,892.2 3,497.5 3,834.2
Total assets $30,224.9 $28,461.5 $29,391.7
U.S. $ 659.4 $ 837.4 $ 805.1
Europe 859.3 864.1 687.4
APMEA 354.6 360.6 302.8
Other Countries &
Corporate 78.8 73.6 97.3
Businesses held for sale 43.7
Discontinued operations 10.3
Total capital
expenditures $ 1,952.1 $ 2,135.7 $ 1,946.6
U.S. $ 423.8 $ 400.9 $ 402.7
Europe 483.2 506.3 473.3
APMEA 202.9 193.4 178.1
Other Countries &
Corporate 106.3 107.2 112.6
Businesses held for sale 26.1
Discontinued operations 21.3
Total depreciation and
amortization $ 1,216.2 $ 1,207.8 $ 1,214.1
(1) Includes $65.2 million of pretax income recorded in Impairment and other charges
(credits), net related primarily to the resolution of certain liabilities retained in con-
nection with the 2007 Latam transaction.
(2) Includes $1.7 billion of pretax impairment charges related to the Company’s sale of
its Latam businesses to a developmental licensee organization.
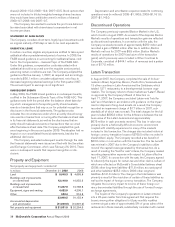
Total long-lived assets, primarily property and equipment,
were (in millions) – Consolidated: 2009–$25,896.1; 2008–
$24,385.8; 2007–$25,186.9. U.S. based: 2009–$10,376.4;
2008–$10,389.7; 2007–$10,043.7.
Debt Financing
LINE OF CREDIT AGREEMENTS
At December 31, 2009, the Company had a $1.3 billion line of
credit agreement expiring in 2012 with fees of 0.05% per annum
on the total commitment, which remained unused. Fees and
interest rates on this line are based on the Company’s long-term
credit rating assigned by Moody’s and Standard & Poor’s. In addi-
tion, certain subsidiaries outside the U.S. had unused lines of
credit totaling $913.4 million at December 31, 2009; these
uncommitted lines of credit were principally short-term and
denominated in various currencies at local market rates of
interest.
The weighted-average interest rate of short-term borrowings
was 4.1% at December 31, 2009 (based on $598.7 million of
foreign currency bank line borrowings) and 4.7% at
December 31, 2008 (based on $232.1 million of commercial
paper and $625.4 million of foreign currency bank line
borrowings).
FAIR VALUES
At December 31, 2009, the fair value of the Company’s debt
obligations was estimated at $11.3 billion, compared to a carry-
ing amount of $10.6 billion. This fair value was estimated using
various pricing models or discounted cash flow analyses that
incorporated quoted market prices and are similar to Level 2
inputs within the valuation hierarchy as defined in the fair value
guidance. The Company has no current plans to retire a sig-
nificant amount of its debt prior to maturity.
DEBT OBLIGATIONS
The Company has incurred debt obligations principally through
public and private offerings and bank loans. There are no provi-
sions in the Company’s debt obligations that would accelerate
repayment of debt as a result of a change in credit ratings or a
material adverse change in the Company’s business. Certain of
the Company’s debt obligations contain cross-acceleration provi-
sions, and restrictions on Company and subsidiary mortgages
and the long-term debt of certain subsidiaries. Under certain
agreements, the Company has the option to retire debt prior to
maturity, either at par or at a premium over par.
42 McDonald’s Corporation Annual Report 2009