McDonalds 2009 Annual Report Download - page 25
Download and view the complete annual report
Please find page 25 of the 2009 McDonalds annual report below. You can navigate through the pages in the report by either clicking on the pages listed below, or by using the keyword search tool below to find specific information within the annual report.-
 1
1 -
2
-
3
-
4
-
5
-
6
-
7
-
8
-
9
-
10
-
11
-
12
-
13
-
14
-
 15
15 -
 16
16 -
 17
17 -
 18
18 -
 19
19 -
 20
20 -
 21
21 -
 22
22 -
 23
23 -
 24
24 -
 25
25 -
 26
26 -
 27
27 -
 28
28 -
 29
29 -
 30
30 -
 31
31 -
 32
32 -
 33
33 -
 34
34 -
 35
35 -
36
-
37
-
38
-
39
-
40
-
41
-
42
-
43
-
44
-
45
-
46
-
47
-
48
-
49
-
50
-
51
-
52
-
53
-
54
-
55
-
56
 |
 |

outstanding common stock with no specified expiration date. In
2009, approximately 50 million shares were repurchased for
$2.9 billion, of which 8 million shares or $0.5 billion were pur-
chased under the new program. The Company reduced its shares
outstanding at year end by over 3% compared with 2008, net of
stock option exercises.
The Company has paid dividends on its common stock for
34 consecutive years and has increased the dividend amount
every year. The 2009 full year dividend of $2.05 per share
reflects the quarterly dividend paid for each of the first three
quarters of $0.50 per share, with an increase to $0.55 per share
paid in the fourth quarter. This 10% increase in the quarterly
dividend equates to a $2.20 per share annual dividend rate and
reflects the Company’s confidence in the ongoing strength and
reliability of its cash flow. As in the past, future dividend amounts
will be considered after reviewing profitability expectations and
financing needs, and will be declared at the discretion of the
Company’s Board of Directors.
Financial Position and Capital Resources
TOTAL ASSETS AND RETURNS
Total assets increased $1.8 billion or 6% in 2009. Excluding the
effect of changes in foreign currency exchange rates, total
assets increased $677 million in 2009. Over 70% of total assets
were in major markets at year-end 2009. Net property and
equipment increased $1.3 billion in 2009 and represented over
70% of total assets at year end. Excluding the effect of changes
in foreign currency exchange rates, net property and equipment
increased $476 million primarily due to capital expenditures,
partly offset by depreciation, the impact of refranchising and
asset retirements related to reimaging.
Operating income is used to compute return on average
assets, while income from continuing operations is used to calcu-
late return on average common equity. Month-end balances are
used to compute both average assets and average common
equity. Assets of discontinued operations are excluded from
average assets since operating income excludes results from
discontinued operations.
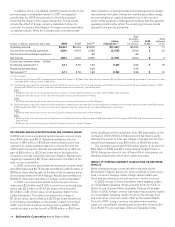
Returns on assets and equity
2009 2008 2007
Return on average assets 23.4% 21.8% 13.2%
Return on average common equity 34.0 30.6 15.1
In 2009, 2008 and 2007, return on average assets and
return on average common equity both benefited from strong
global operating results. During 2010, the Company will continue
to concentrate restaurant openings and invest new capital in
markets with acceptable returns or opportunities for long-term
growth.
In 2009, impairment and other charges (credits), net bene-
fited return on average assets and return on average common
equity by 0.2 percentage points and 0.7 percentage points,
respectively.
In 2007, impairment and other charges (credits), net reduced
return on average assets by 5.4 percentage points. Impairment
and other charges (credits), net partly offset by the 2007 net tax
benefit resulting from the completion of an IRS examination,
reduced return on average common equity by 8.5 percentage
points in 2007.
Operating income, as reported, does not include interest
income; however, cash balances are included in average assets.
The inclusion of cash balances in average assets reduced return
on average assets by 2.0 percentage points, 1.9 percentage
points and 1.3 percentage points in 2009, 2008 and 2007,
respectively.
FINANCING AND MARKET RISK
The Company generally borrows on a long-term basis and is
exposed to the impact of interest rate changes and foreign cur-
rency fluctuations. Debt obligations at December 31, 2009
totaled $10.6 billion, compared with $10.2 billion at
December 31, 2008. The net increase in 2009 was primarily due
to net issuances of $219 million and changes in exchange rates
on foreign currency denominated debt of $128 million.
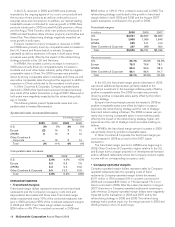
Debt highlights(1)
2009 2008 2007
Fixed-rate debt as a percent of total
debt(2,3) 68% 72% 58%
Weighted-average annual interest
rate of total debt(3) 4.5 5.0 4.7
Foreign currency-denominated debt
as a percent of total debt(2) 43 45 66
Total debt as a percent of total
capitalization (total debt and total
shareholders’ equity)(2) 43 43 38
Cash provided by operations as a
percent of total debt(2) 55 59 53
(1) All percentages are as of December 31, except for the weighted-average annual
interest rate, which is for the year.
(2) Based on debt obligations before the effect of fair value hedging adjustments. This
effect is excluded as these adjustments have no impact on the obligation at maturity.
See Debt financing note to the consolidated financial statements.
(3) Includes the effect of interest rate exchange agreements.
Fitch, Standard & Poor’s and Moody’s currently rate, with a
stable outlook, the Company’s commercial paper F1, A-1 and
P-2, respectively; and its long-term debt A, A and A3,
respectively. The Company’s key metrics for monitoring its credit
structure are shown in the preceding table. While the Company
targets these metrics for ease of focus, it also considers similar
credit ratios that incorporate capitalized operating leases to esti-
mate total adjusted debt. Total adjusted debt, a term that is
commonly used by the rating agencies referred to above,
includes debt outstanding on the Company’s balance sheet plus
an adjustment to capitalize operating leases. Based on their most
recent calculations, these agencies add between $6 billion and
$12 billion to debt for lease capitalization purposes, which
increases total debt as a percent of total capitalization and
reduces cash provided by operations as a percent of total debt
for credit rating purposes. The Company believes the rating
agency methodology for capitalizing leases requires certain
adjustments. These adjustments include: excluding percent rents
in excess of minimum rents; excluding certain Company-operated
restaurant lease agreements outside the U.S. that are cancelable
with minimal penalties (representing approximately 30% of
Company-operated restaurant minimum rents outside the U.S.,
based on the Company’s estimate); capitalizing non-restaurant
leases using a multiple of three times rent expense; and reducing
total rent expense by a percentage of the annual minimum rent
McDonald’s Corporation Annual Report 2009 23