Nike 2014 Annual Report Download - page 19
Download and view the complete annual report
Please find page 19 of the 2014 Nike annual report below. You can navigate through the pages in the report by either clicking on the pages listed below, or by using the keyword search tool below to find specific information within the annual report.-
 1
1 -
2
-
3
-
4
-
5
-
6
-
7
-
8
-
 9
9 -
 10
10 -
 11
11 -
 12
12 -
 13
13 -
 14
14 -
 15
15 -
 16
16 -
 17
17 -
 18
18 -
 19
19 -
 20
20 -
 21
21 -
 22
22 -
 23
23 -
 24
24 -
 25
25 -
 26
26 -
 27
27 -
 28
28 -
 29
29 -
30
-
31
-
32
-
33
-
34
-
35
-
36
-
37
-
38
-
39
-
40
-
41
-
42
-
43
-
44
-
45
-
46
-
47
-
48
-
49
-
50
-
51
-
52
-
53
-
54
-
55
-
56
-
57
-
58
-
59
-
60
-
61
-
62
-
63
-
64
-
65
-
66
-
67
-
68
-
69
-
70
-
71
-
72
-
73
-
74
-
75
-
76
-
77
-
78
-
79
-
80
-
81
-
82
-
83
-
84
-
85
-
86
 |
 |

PART II
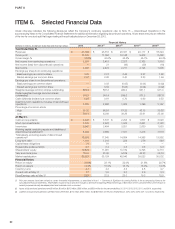
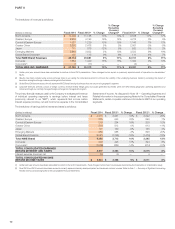
ITEM 6. Selected Financial Data
Unless otherwise indicated, the following disclosures reflect the Company’s continuing operations; refer to Note 15 — Discontinued Operations in the
accompanying Notes to the Consolidated Financial Statements for additional information regarding discontinued operations. All per share amounts are reflective
of the two-for-one stock split that began trading at the split-adjusted price on December 26, 2012.
(Dollars in millions, except per share data and financial ratios)
Financial History
2014 2013(1) 2012(1) 2011(1) 2010(1)
Year Ended May 31,
Revenues $ 27,799 $ 25,313 $ 23,331 $ 20,117 $ 18,324
Gross profit 12,446 11,034 10,148 9,202 8,498
Gross margin % 44.8% 43.6% 43.5% 45.7% 46.4%
Net income from continuing operations 2,693 2,451 2,257 2,163 1,916
Net income (loss) from discontinued operations — 21 (46) (39) (16)
Net income 2,693 2,472 2,211 2,124 1,900
Earnings per share from continuing operations:
Basic earnings per common share 3.05 2.74 2.45 2.27 1.98
Diluted earnings per common share 2.97 2.68 2.40 2.23 1.94
Earnings per share from discontinued operations:
Basic earnings per common share — 0.02 (0.05) (0.04) (0.02)
Diluted earnings per common share — 0.02 (0.05) (0.04) (0.02)
Weighted average common shares outstanding 883.4 897.3 920.0 951.1 971.0
Diluted weighted average common shares
outstanding 905.8 916.4 939.6 971.3 987.8
Cash dividends declared per common share 0.93 0.81 0.70 0.60 0.53
Cash flow from operations, inclusive of discontinued
operations 3,003 2,968 1,824 1,796 3,167
Price range of common stock:
High 80.26 65.91 57.20 46.15 39.28
Low 59.11 43.89 39.29 33.61 25.08
At May 31,
Cash and equivalents $ 2,220 $ 3,337 $ 2,254 $ 1,877 $ 3,026
Short-term investments 2,922 2,628 1,503 2,661 2,120
Inventories 3,947 3,484 3,251 2,630 1,953
Working capital, excluding assets and liabilities of
discontinued operations(2)(3) 8,669 9,686 7,531 7,275 7,518
Total assets, excluding assets of discontinued
operations(2) 18,594 17,545 14,804 14,398 13,852
Long-term debt 1,199 1,210 228 276 446
Capital lease obligations 74 81 — — —
Redeemable preferred stock 0.3 0.3 0.3 0.3 0.3
Shareholders’ equity 10,824 11,081 10,319 9,793 9,713
Year-end stock price 76.91 61.66 54.09 42.23 36.19
Market capitalization 66,921 55,124 49,546 39,523 35,032
Financial Ratios:
Return on equity 24.6% 23.1% 22.0% 21.8% 20.7%
Return on assets 14.9% 15.3% 15.1% 15.0% 14.3%
Inventory turns 4.1 4.2 4.5 4.8 4.7
Current ratio at May 31 2.7 3.5 3.0 2.9 3.3
Price/Earnings ratio at May 31 25.9 22.8 23.0 19.3 18.8
(1) Prior year amounts have been revised to correct immaterial misstatements, as described in Note 1 — Summary of Significant Accounting Policies in the accompanying Notes to the
Consolidated Financial Statements. Shareholders’ equity for fiscal year 2010 includes a decrease to beginning Retained earnings of $34 million for the cumulative effect of the revision to
correctly expense internally developed patent and trademark costs as incurred.
(2) Assets of discontinued operations were $0 million, $0 million, $615 million, $560 million, and $530 million for the years ended May 31, 2014, 2013, 2012, 2011, and 2010, respectively.
(3) Liabilities of discontinued operations were $0 million, $18 million, $170 million, $184 million, and $182 million for the years ended May 31, 2014, 2013, 2012, 2011, and 2010, respectively.
62