Nike 2014 Annual Report Download - page 20
Download and view the complete annual report
Please find page 20 of the 2014 Nike annual report below. You can navigate through the pages in the report by either clicking on the pages listed below, or by using the keyword search tool below to find specific information within the annual report.-
 1
1 -
2
-
3
-
4
-
5
-
6
-
7
-
8
-
9
-
 10
10 -
 11
11 -
 12
12 -
 13
13 -
 14
14 -
 15
15 -
 16
16 -
 17
17 -
 18
18 -
 19
19 -
 20
20 -
 21
21 -
 22
22 -
 23
23 -
 24
24 -
 25
25 -
 26
26 -
 27
27 -
 28
28 -
 29
29 -
 30
30 -
31
-
32
-
33
-
34
-
35
-
36
-
37
-
38
-
39
-
40
-
41
-
42
-
43
-
44
-
45
-
46
-
47
-
48
-
49
-
50
-
51
-
52
-
53
-
54
-
55
-
56
-
57
-
58
-
59
-
60
-
61
-
62
-
63
-
64
-
65
-
66
-
67
-
68
-
69
-
70
-
71
-
72
-
73
-
74
-
75
-
76
-
77
-
78
-
79
-
80
-
81
-
82
-
83
-
84
-
85
-
86
 |
 |

PART II
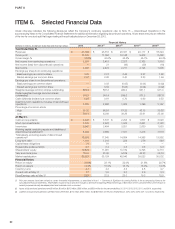
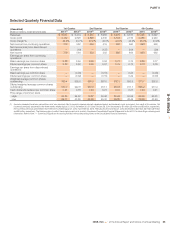
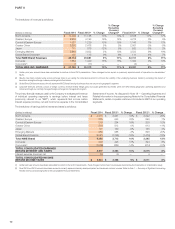
Selected Quarterly Financial Data
(Unaudited)
(Dollars in millions, except per share data)
1st Quarter 2nd Quarter 3rd Quarter 4th Quarter
2014(1) 2013(1) 2014(1) 2013(1) 2014(1) 2013(1) 2014 2013(1)
Revenues $ 6,971 $ 6,474 $ 6,431 $ 5,955 $ 6,972 $ 6,187 $7,425 $ 6,697
Gross profit 3,132 2,828 2,826 2,530 3,103 2,736 3,385 2,940
Gross margin % 44.9% 43.7% 43.9% 42.5% 44.5% 44.2% 45.6% 43.9%
Net income from continuing operations 779 582 534 519 682 660 698 690
Net income (loss) from discontinued
operations — (18) — (137) — 204 — (28)
Net income 779 564 534 382 682 864 698 662
Earnings per share from continuing
operations:
Basic earnings per common share 0.88 0.64 0.60 0.58 0.77 0.74 0.80 0.77
Diluted earnings per common share 0.86 0.63 0.59 0.57 0.75 0.72 0.78 0.76
Earnings per share from discontinued
operations:
Basic earnings per common share — (0.03) — (0.15) — 0.23 — (0.03)
Diluted earnings per common share — (0.02) — (0.15) — 0.22 — (0.03)
Weighted average common shares
outstanding 889.4 905.6 888.0 897.0 882.3 893.9 873.7 892.6
Diluted weighted average common shares
outstanding 910.7 922.8 910.6 913.1 904.8 911.7 895.2 913.4
Cash dividends declared per common share 0.21 0.18 0.24 0.21 0.24 0.21 0.24 0.21
Price range of common stock
High 66.85 54.32 79.87 50.42 80.26 55.55 80.09 65.91
Low 59.11 43.89 63.50 45.30 69.85 48.46 70.60 53.49
(1) Amounts presented have been revised from what was previously filed to correctly expense internally developed patent and trademark costs as incurred. As a result of this revision, Net
income as previously presented for the three months ended August 31, 2013, November 30, 2013 and February 28, 2014 decreased by $1 million, $3 million and $3 million, respectively.
Net income as previously presented for the three months ended August 31, 2012, November 30, 2012, February 28, 2013 and May 31, 2013 decreased by $3 million, $2 million, $2 million
and $6 million, respectively. The Company plans to reflect the revised amounts in its quarterly Condensed Consolidated Financial Statements for fiscal 2014 in future filings containing such
information. Refer to Note 1 — Summary of Significant Accounting Policies in the accompanying Notes to the Consolidated Financial Statements.
NIKE, INC. 2014 Annual Report and Notice of Annual Meeting 63
FORM 10-K