Nike 2014 Annual Report Download - page 63
Download and view the complete annual report
Please find page 63 of the 2014 Nike annual report below. You can navigate through the pages in the report by either clicking on the pages listed below, or by using the keyword search tool below to find specific information within the annual report.-
 1
1 -
2
-
3
-
4
-
5
-
6
-
7
-
8
-
9
-
10
-
11
-
12
-
13
-
14
-
15
-
16
-
17
-
18
-
19
-
20
-
21
-
22
-
23
-
24
-
25
-
26
-
27
-
28
-
29
-
30
-
31
-
32
-
33
-
34
-
35
-
36
-
37
-
38
-
39
-
40
-
41
-
42
-
43
-
44
-
45
-
46
-
47
-
48
-
49
-
50
-
51
-
52
-
 53
53 -
 54
54 -
 55
55 -
 56
56 -
 57
57 -
 58
58 -
 59
59 -
 60
60 -
 61
61 -
 62
62 -
 63
63 -
 64
64 -
 65
65 -
 66
66 -
 67
67 -
 68
68 -
 69
69 -
 70
70 -
 71
71 -
 72
72 -
 73
73 -
74
-
75
-
76
-
77
-
78
-
79
-
80
-
81
-
82
-
83
-
84
-
85
-
86
 |
 |

PART II
NOTE 11 — Common Stock and Stock-Based Compensation
The authorized number of shares of Class A Common Stock, no par value,
and Class B Common Stock, no par value, are 200 million and 1,200 million,
respectively. Each share of Class A Common Stock is convertible into one
share of Class B Common Stock. Voting rights of Class B Common Stock are
limited in certain circumstances with respect to the election of directors. There
are no differences in the dividend and liquidation preferences or participation
rights of the Class A and Class B common shareholders.
In 1990, the Board of Directors adopted, and the shareholders approved, the
NIKE, Inc. 1990 Stock Incentive Plan (the “1990 Plan”). The 1990 Plan, as
amended, provides for the issuance of up to 326 million previously unissued
shares of Class B Common Stock in connection with stock options and other
awards granted under the plan. The 1990 Plan authorizes the grant of non-
statutory stock options, incentive stock options, stock appreciation rights,
restricted stock, restricted stock units, and performance-based awards. The
exercise price for stock options and stock appreciation rights may not be less
than the fair market value of the underlying shares on the date of grant. A
committee of the Board of Directors administers the 1990 Plan. The
committee has the authority to determine the employees to whom awards will
be made, the amount of the awards, and the other terms and conditions of
the awards. Substantially all stock option grants outstanding under the 1990
Plan were granted in the first quarter of each fiscal year, vest ratably over four
years, and expire 10 years from the date of grant.
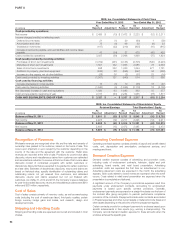
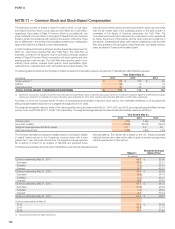
The following table summarizes the Company’s total stock-based compensation expense recognized in Total selling and administrative expense:
Year Ended May 31,
(In millions) 2014 2013 2012
Stock options(1) $ 125 $ 123 $ 96
ESPPs 22 19 16
Restricted stock 30 32 18
TOTAL STOCK-BASED COMPENSATION EXPENSE $ 177 $ 174 $ 130
(1) Expense for stock options includes the expense associated with stock appreciation rights. Accelerated stock option expense is recorded for employees eligible for accelerated stock option
vesting upon retirement. Accelerated stock option expense for years ended May 31, 2014, 2013, and 2012 was $15 million, $22 million, and $17 million, respectively.
As of May 31, 2014, the Company had $179 million of unrecognized compensation costs from stock options, net of estimated forfeitures, to be recognized as
selling and administrative expense over a weighted average period of 2.1 years.
The weighted average fair value per share of the options granted during the years ended May 31, 2014, 2013, and 2012, as computed using the Black-Scholes
pricing model, was $14.89, $12.71, and $11.08, respectively. The weighted average assumptions used to estimate these fair values are as follows:
Year Ended May 31,
2014 2013 2012
Dividend yield 1.3% 1.5% 1.4%
Expected volatility 27.9% 35.0% 29.5%
Weighted average expected life (in years) 5.3 5.3 5.0
Risk-free interest rate 1.3% 0.6% 1.4%
The Company estimates the expected volatility based on the implied volatility
in market traded options on the Company’s common stock with a term
greater than 1 year, along with other factors. The weighted average expected
life of options is based on an analysis of historical and expected future
exercise patterns. The interest rate is based on the U.S. Treasury (constant
maturity) risk-free rate in effect at the date of grant for periods corresponding
with the expected term of the options.
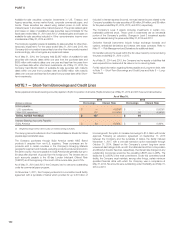
The following summarizes the stock option transactions under the plan discussed above:
Shares(1)
Weighted Average
Option Price
(In millions)
Options outstanding May 31, 2011 69.6 $ 25.65
Exercised (18.0) 22.81
Forfeited (1.0) 35.61
Granted 13.7 45.87
Options outstanding May 31, 2012 64.3 $ 30.59
Exercised (9.9) 24.70
Forfeited (1.3) 40.14
Granted 14.6 46.55
Options outstanding May 31, 2013 67.7 $ 34.72
Exercised (11.0) 28.29
Forfeited (1.3) 48.33
Granted 8.1 63.54
Options outstanding May 31, 2014 63.5 $ 39.28
Options exercisable at May 31,
2012 33.9 $ 24.38
2013 35.9 27.70
2014 37.0 31.42
(1) Includes stock appreciation rights transactions.
106