Nike 2014 Annual Report Download - page 70
Download and view the complete annual report
Please find page 70 of the 2014 Nike annual report below. You can navigate through the pages in the report by either clicking on the pages listed below, or by using the keyword search tool below to find specific information within the annual report.-
 1
1 -
2
-
3
-
4
-
5
-
6
-
7
-
8
-
9
-
10
-
11
-
12
-
13
-
14
-
15
-
16
-
17
-
18
-
19
-
20
-
21
-
22
-
23
-
24
-
25
-
26
-
27
-
28
-
29
-
30
-
31
-
32
-
33
-
34
-
35
-
36
-
37
-
38
-
39
-
40
-
41
-
42
-
43
-
44
-
45
-
46
-
47
-
48
-
49
-
50
-
51
-
52
-
53
-
54
-
55
-
56
-
57
-
58
-
59
-
 60
60 -
 61
61 -
 62
62 -
 63
63 -
 64
64 -
 65
65 -
 66
66 -
 67
67 -
 68
68 -
 69
69 -
 70
70 -
 71
71 -
 72
72 -
 73
73 -
 74
74 -
 75
75 -
 76
76 -
 77
77 -
 78
78 -
 79
79 -
 80
80 -
81
-
82
-
83
-
84
-
85
-
86
 |
 |
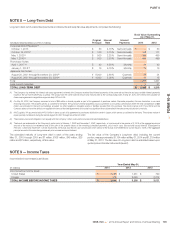
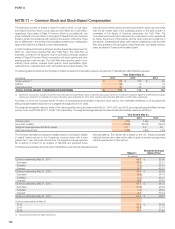
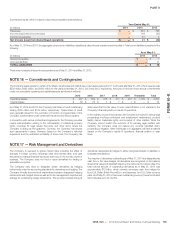
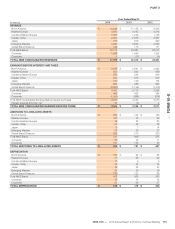
PART II
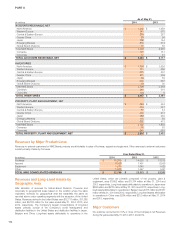
Year Ended May 31,
(In millions) 2014 2013 2012
REVENUE
North America $ 12,299 $ 11,158 $ 9,538
Western Europe 4,979 4,193 4,212
Central & Eastern Europe 1,387 1,229 1,146
Greater China 2,602 2,478 2,561
Japan 771 876 920
Emerging Markets 3,949 3,832 3,523
Global Brand Divisions 125 115 111
Total NIKE Brand 26,112 23,881 22,011
Converse 1,684 1,449 1,324
Corporate 3 (17) (4)
TOTAL NIKE CONSOLIDATED REVENUES $ 27,799 $ 25,313 $ 23,331
EARNINGS BEFORE INTEREST AND TAXES
North America $ 3,075 $ 2,641 $ 2,092
Western Europe 855 643 599
Central & Eastern Europe 279 234 209
Greater China 816 813 913
Japan 131 139 135
Emerging Markets 955 988 826
Global Brand Divisions (2,021) (1,746) (1,479)
Total NIKE Brand 4,090 3,712 3,295
Converse 496 425 394
Corporate (1,009) (884) (674)
Total NIKE Consolidated Earnings Before Interest and Taxes 3,577 3,253 3,015
Interest expense (income), net 33 (3) 4
TOTAL NIKE CONSOLIDATED EARNINGS BEFORE TAXES $ 3,544 $ 3,256 $ 3,011
ADDITIONS TO LONG-LIVED ASSETS
North America $ 240 $ 132 $ 139
Western Europe 120 75 93
Central & Eastern Europe 19 22 20
Greater China 63 52 38
Japan 9714
Emerging Markets 55 50 27
Global Brand Divisions 225 270 220
Total NIKE Brand 731 608 551
Converse 30 20 11
Corporate 161 153 25
TOTAL ADDITIONS TO LONG-LIVED ASSETS $ 922 $ 781 $ 587
DEPRECIATION
North America $ 109 $ 92 $ 85
Western Europe 71 68 62
Central & Eastern Europe 11 9 6
Greater China 38 32 25
Japan 19 22 23
Emerging Markets 25 20 16
Global Brand Divisions 175 122 85
Total NIKE Brand 448 365 302
Converse 16 15 14
Corporate 54 38 37
TOTAL DEPRECIATION $ 518 $ 418 $ 353
NIKE, INC. 2014 Annual Report and Notice of Annual Meeting 113
FORM 10-K