Nike 2014 Annual Report Download - page 53
Download and view the complete annual report
Please find page 53 of the 2014 Nike annual report below. You can navigate through the pages in the report by either clicking on the pages listed below, or by using the keyword search tool below to find specific information within the annual report.-
 1
1 -
2
-
3
-
4
-
5
-
6
-
7
-
8
-
9
-
10
-
11
-
12
-
13
-
14
-
15
-
16
-
17
-
18
-
19
-
20
-
21
-
22
-
23
-
24
-
25
-
26
-
27
-
28
-
29
-
30
-
31
-
32
-
33
-
34
-
35
-
36
-
37
-
38
-
39
-
40
-
41
-
42
-
 43
43 -
 44
44 -
 45
45 -
 46
46 -
 47
47 -
 48
48 -
 49
49 -
 50
50 -
 51
51 -
 52
52 -
 53
53 -
 54
54 -
 55
55 -
 56
56 -
 57
57 -
 58
58 -
 59
59 -
 60
60 -
 61
61 -
 62
62 -
 63
63 -
64
-
65
-
66
-
67
-
68
-
69
-
70
-
71
-
72
-
73
-
74
-
75
-
76
-
77
-
78
-
79
-
80
-
81
-
82
-
83
-
84
-
85
-
86
 |
 |

PART II
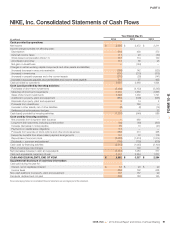
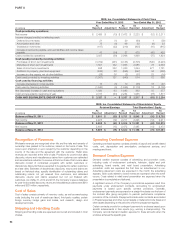
NIKE, Inc. Consolidated Statements of Cash Flows
Year Ended May 31, 2013 Year Ended May 31, 2012
(In millions)
As
Reported Adjustment
As
Revised
As
Reported Adjustment
As
Revised
Cash provided by operations:
Net income $ 2,485 $ (13) $ 2,472 $ 2,223 $ (12) $ 2,211
Income charges (credits) not affecting cash:
Deferred income taxes 21 (1) 20 (60) 1 (59)
Amortization and other 75 (9) 66 32 (9) 23
(Increase) in inventories (197) (22) (219) (805) (10) (815)
Increase in accounts payable, accrued liabilities and income taxes
payable 41 (14) 27 470 (45) 425
Cash provided by operations 3,027 (59) 2,968 1,899 (75) 1,824
Cash (used) provided by investing activities:
Purchases of short-term investments (3,702) (431) (4,133) (2,705) (540) (3,245)
Maturities of short-term investments 1,501 162 1,663 2,585 78 2,663
Sales of short-term investments 998 332 1,330 1,244 477 1,721
Additions to property, plant and equipment (636) 38 (598) (597) 34 (563)
Increase in other assets, net of other liabilities (28) 26 (2) (37) 23 (14)
Cash (used) provided by investing activities (1,067) 127 (940) 514 72 586
Cash used by financing activities:
Increase (decrease) in notes payable 15 (5) 10 (65) 18 (47)
Cash used by financing activities (1,040) (5) (1,045) (2,118) 18 (2,100)
Net (decrease) increase in cash and equivalents 1,020 63 1,083 362 15 377
Cash and equivalents, beginning of year 2,317 (63) 2,254 1,955 (78) 1,877
CASH AND EQUIVALENTS, END OF YEAR $ 3,337 $ — $ 3,337 $ 2,317 $ (63) $ 2,254
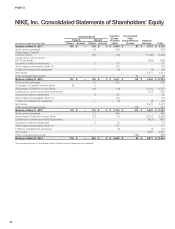
NIKE, Inc. Consolidated Statements of Shareholders’ Equity
Retained Earnings Total Shareholders’ Equity
(In millions)
As
Reported Adjustment
As
Revised
As
Reported Adjustment
As
Revised
Balance at May 31, 2011 $ 5,801 $ (50) $ 5,751 $ 9,843 $ (50) $ 9,793
Net income 2,223 (12) 2,211 2,223 (12) 2,211
Balance at May 31, 2012 $ 5,588 $ (62) $ 5,526 $ 10,381 $ (62) $10,319
Net income 2,485 (13) 2,472 2,485 (13) 2,472
Balance at May 31, 2013 $ 5,695 $ (75) $ 5,620 $ 11,156 $ (75) $11,081
Recognition of Revenues
Wholesale revenues are recognized when title and the risks and rewards of
ownership have passed to the customer, based on the terms of sale. This
occurs upon shipment or upon receipt by the customer depending on the
country of the sale and the agreement with the customer. Retail store
revenues are recorded at the time of sale. Provisions for post-invoice sales
discounts, returns and miscellaneous claims from customers are estimated
and recorded as a reduction to revenue at the time of sale. Post-invoice sales
discounts consist of contractual programs with certain customers or
discretionary discounts that are expected to be granted to certain customers
at a later date. Estimates of discretionary discounts, returns and claims are
based on historical rates, specific identification of outstanding claims and
outstanding returns not yet received from customers, and estimated
discounts, returns and claims expected but not yet finalized with
customers. As of May 31, 2014 and 2013, the Company’s reserve balances
for post-invoice sales discounts, returns and miscellaneous claims were $610
million and $531 million, respectively.
Cost of Sales
Cost of sales consists primarily of inventory costs, as well as warehousing
costs (including the cost of warehouse labor), third-party royalties, certain
foreign currency hedge gains and losses, and research, design and
development costs.
Shipping and Handling Costs
Shipping and handling costs are expensed as incurred and included in Cost
of sales.
Operating Overhead Expense
Operating overhead expense consists primarily of payroll and benefit related
costs, rent, depreciation and amortization, professional services, and
meetings and travel.
Demand Creation Expense
Demand creation expense consists of advertising and promotion costs,
including costs of endorsement contracts, television, digital and print
advertising, brand events, and retail brand presentation. Advertising
production costs are expensed the first time an advertisement is run.
Advertising placement costs are expensed in the month the advertising
appears, while costs related to brand events are expensed when the event
occurs. Costs related to retail brand presentation are expensed when the
presentation is completed and delivered.
A significant amount of the Company’s promotional expenses result from
payments under endorsement contracts. Accounting for endorsement
payments is based upon specific contract provisions. Generally,
endorsement payments are expensed on a straight-line basis over the term of
the contract after giving recognition to periodic performance compliance
provisions of the contracts. Prepayments made under contracts are included
in Prepaid expenses and other current assets or Deferred income taxes and
other assets depending on the period to which the prepayment applies.
Certain contracts provide for contingent payments to endorsers based upon
specific achievements in their sports (e.g., winning a championship). The
Company records Demand creation expense for these amounts when the
endorser achieves the specific goal.
96