Nike 2014 Annual Report Download - page 71
Download and view the complete annual report
Please find page 71 of the 2014 Nike annual report below. You can navigate through the pages in the report by either clicking on the pages listed below, or by using the keyword search tool below to find specific information within the annual report.-
 1
1 -
2
-
3
-
4
-
5
-
6
-
7
-
8
-
9
-
10
-
11
-
12
-
13
-
14
-
15
-
16
-
17
-
18
-
19
-
20
-
21
-
22
-
23
-
24
-
25
-
26
-
27
-
28
-
29
-
30
-
31
-
32
-
33
-
34
-
35
-
36
-
37
-
38
-
39
-
40
-
41
-
42
-
43
-
44
-
45
-
46
-
47
-
48
-
49
-
50
-
51
-
52
-
53
-
54
-
55
-
56
-
57
-
58
-
59
-
60
-
 61
61 -
 62
62 -
 63
63 -
 64
64 -
 65
65 -
 66
66 -
 67
67 -
 68
68 -
 69
69 -
 70
70 -
 71
71 -
 72
72 -
 73
73 -
 74
74 -
 75
75 -
 76
76 -
 77
77 -
 78
78 -
 79
79 -
 80
80 -
 81
81 -
82
-
83
-
84
-
85
-
86
 |
 |

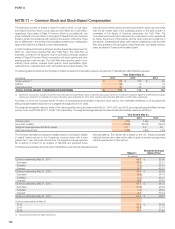
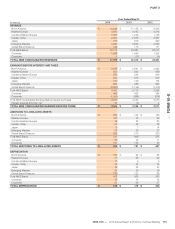
PART II
As of May 31,
(In millions) 2014 2013
ACCOUNTS RECEIVABLE, NET
North America $ 1,505 $ 1,459
Western Europe 341 375
Central & Eastern Europe 280 287
Greater China 68 56
Japan 162 154
Emerging Markets 819 574
Global Brand Divisions 71 30
Total NIKE Brand 3,246 2,935
Converse 171 131
Corporate 17 51
TOTAL ACCOUNTS RECEIVABLE, NET $ 3,434 $ 3,117
INVENTORIES
North America $ 1,758 $ 1,626
Western Europe 711 560
Central & Eastern Europe 271 207
Greater China 221 209
Japan 94 69
Emerging Markets 633 567
Global Brand Divisions 18 30
Total NIKE Brand 3,706 3,268
Converse 261 210
Corporate (20) 6
TOTAL INVENTORIES $ 3,947 $ 3,484
PROPERTY, PLANT AND EQUIPMENT, NET
North America $ 545 $ 424
Western Europe 384 327
Central & Eastern Europe 51 44
Greater China 232 213
Japan 258 269
Emerging Markets 115 89
Global Brand Divisions 537 473
Total NIKE Brand 2,122 1,839
Converse 70 52
Corporate 642 561
TOTAL PROPERTY, PLANT AND EQUIPMENT, NET $ 2,834 $ 2,452
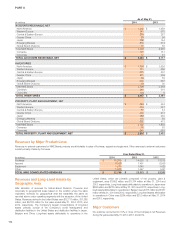
Revenues by Major Product Lines
Revenues to external customers for NIKE Brand products are attributable to sales of footwear, apparel and equipment. Other revenues to external customers
consist primarily of sales by Converse.
Year Ended May 31,
(In millions) 2014 2013 2012
Footwear $ 16,208 $ 14,635 $ 13,513
Apparel 8,109 7,491 6,958
Equipment 1,670 1,640 1,429
Other 1,812 1,547 1,431
TOTAL NIKE CONSOLIDATED REVENUES $ 27,799 $ 25,313 $ 23,331
Revenues and Long-Lived Assets by
Geographic Area
After allocation of revenues for Global Brand Divisions, Converse and
Corporate to geographical areas based on the location where the sales
originated, revenues by geographical area are essentially the same as
reported above under operating segments with the exception of the United
States. Revenues derived in the United States were $12,711 million, $11,385
million, and $9,793 million for the years ended May 31, 2014, 2013, and
2012, respectively. The Company’s largest concentrations of long-lived
assets primarily consist of the Company’s world headquarters and
distribution facilities in the United States and distribution facilities in Japan,
Belgium and China. Long-lived assets attributable to operations in the
United States, which are primarily composed of net property, plant &
equipment, were $1,652 million and $1,374 million at May 31, 2014 and
2013, respectively. Long-lived assets attributable to operations in Japan were
$258 million and $270 million at May 31, 2014 and 2013, respectively. Long-
lived assets attributable to operations in Belgium were $175 million and $157
million at May 31, 2014 and 2013, respectively. Long-lived assets attributable
to operations in China were $234 million and $212 million at May 31, 2014
and 2013, respectively.
Major Customers
No customer accounted for 10% or more of the Company’s net Revenues
during the years ended May 31, 2014, 2013, and 2012.
114