Nike 2014 Annual Report Download - page 30
Download and view the complete annual report
Please find page 30 of the 2014 Nike annual report below. You can navigate through the pages in the report by either clicking on the pages listed below, or by using the keyword search tool below to find specific information within the annual report.-
 1
1 -
2
-
3
-
4
-
5
-
6
-
7
-
8
-
9
-
10
-
11
-
12
-
13
-
14
-
15
-
16
-
17
-
18
-
19
-
 20
20 -
 21
21 -
 22
22 -
 23
23 -
 24
24 -
 25
25 -
 26
26 -
 27
27 -
 28
28 -
 29
29 -
 30
30 -
 31
31 -
 32
32 -
 33
33 -
 34
34 -
 35
35 -
 36
36 -
 37
37 -
 38
38 -
 39
39 -
 40
40 -
41
-
42
-
43
-
44
-
45
-
46
-
47
-
48
-
49
-
50
-
51
-
52
-
53
-
54
-
55
-
56
-
57
-
58
-
59
-
60
-
61
-
62
-
63
-
64
-
65
-
66
-
67
-
68
-
69
-
70
-
71
-
72
-
73
-
74
-
75
-
76
-
77
-
78
-
79
-
80
-
81
-
82
-
83
-
84
-
85
-
86
 |
 |
PART II
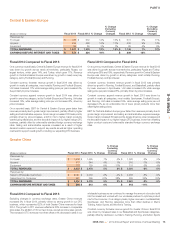
Central & Eastern Europe
(Dollars in millions) Fiscal 2014 Fiscal 2013 % Change
% Change
Excluding
Currency
Changes Fiscal 2012 % Change
% Change
Excluding
Currency
Changes
Revenues by:
Footwear $ 763 $ 672 14% 15% $ 631 6% 11%
Apparel 532 468 14% 17% 430 9% 14%
Equipment 92 89 3% 7% 85 5% 9%
TOTAL REVENUES $ 1,387 $ 1,229 13% 15% $ 1,146 7% 12%
EARNINGS BEFORE INTEREST AND TAXES $ 279 $ 234 19% $ 209 12%
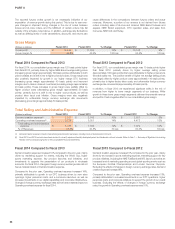
Fiscal 2014 Compared to Fiscal 2013
On a currency neutral basis, Central & Eastern Europe revenue for fiscal 2014
was driven by growth across nearly all territories, particularly Russia, our
largest territory, which grew 14%, and Turkey, which grew 17%. Revenue
growth in Central & Eastern Europe was driven by growth in nearly every key
category, led by Football (Soccer) and Running.
Constant currency footwear revenue growth in fiscal 2014 was driven by
growth in nearly all categories, most notably Running and Football (Soccer).
Unit sales increased 11% while average selling price per pair increased 4%,
due primarily to price increases.
Constant currency apparel revenue growth in fiscal 2014 was driven by
growth in every key category, led by Football (Soccer) and Running. Unit sales
increased 15%, while average selling price per unit increased 2%, driven by
price increases.
On a reported basis, EBIT for Central & Eastern Europe grew faster than
revenues primarily due to gross margin improvement, partially offset by higher
selling and administrative expense. Gross margin increased 180 basis points,
primarily driven by price increases, a shift in mix to higher margin products,
warehousing efficiencies, and the favorable impact of our higher margin DTC
business, partially offset by unfavorable standard foreign currency exchange
rates. Selling and administrative expense increased as a result of higher
demand creation expense to support key events as well as higher operating
overhead to support overall growth, including our expanding DTC business.
Fiscal 2013 Compared to Fiscal 2012
On a currency neutral basis, Central & Eastern Europe revenue for fiscal 2013
was driven by growth across most territories, particularly Russia and Turkey,
which grew 28% and 19%, respectively. Revenue growth in Central & Eastern
Europe was driven by growth in all key categories, most notably Running,
Football (Soccer), and Sportswear.
Constant currency footwear revenue growth in fiscal 2013 was primarily
driven by growth in Running, Football (Soccer), and Basketball, partially offset
by lower revenues in Sportswear. Unit sales increased 6% while average
selling price per pair increased 5%, primarily driven by price increases.
Constant currency apparel revenue growth in fiscal 2013 was driven by
growth in nearly all categories, most notably Sportswear, Football (Soccer),
and Running. Unit sales increased 16%, while average selling price per unit
decreased 2%, as an unfavorable mix of lower priced products more than
offset higher selling prices.
EBIT for Central & Eastern Europe grew faster than revenues primarily due to
gross margin improvement and selling and administrative expense leverage.
Gross margin increased 30 basis points, largely driven by price increases and
the favorable impact of our higher margin DTC business, more than offsetting
higher product costs and unfavorable standard foreign currency exchange
rates.
Greater China
(Dollars in millions) Fiscal 2014 Fiscal 2013 % Change
% Change
Excluding
Currency
Changes Fiscal 2012 % Change
% Change
Excluding
Currency
Changes
Revenues by:
Footwear $ 1,600 $ 1,495 7% 5% $ 1,520 -2% -3%
Apparel 876 844 4% 1% 910 -7% -8%
Equipment 126 139 -9% -11% 131 6% 4%
TOTAL REVENUES $ 2,602 $ 2,478 5% 3% $ 2,561 -3% -5%
Revenues by:
Sales to Wholesale Customers $ 2,041 $ 2,079 -2% -4% $ 2,266 -8% -9%
Sales Direct to Consumer 561 399 41% 38% 295 35% 33%
TOTAL REVENUES $ 2,602 $ 2,478 5% 3% $ 2,561 -3% -5%
EARNINGS BEFORE INTEREST AND TAXES $ 816 $ 813 0% $ 913 -11%
Fiscal 2014 Compared to Fiscal 2013
Excluding changes in currency exchange rates, Greater China revenues
increased 3% in fiscal 2014, primarily driven by strong growth in our DTC
business, which represented 22% of total Greater China revenues for fiscal
2014. The growth in DTC revenues reflected a 20% increase in comparable
store sales, the addition of 30 net new stores, as well as online sales growth.
The increase in DTC revenues more than offset a 4% decrease in sales in our
wholesale business as we continued to manage the amount of product sold
into the market and worked with our wholesale partners to optimize product
mix for the consumer. On a category basis, higher revenues in our Basketball,
Sportswear, and Running categories more than offset declines in Men’s
Training, Action Sports, and Women’s Training.
Constant currency footwear revenue growth for Greater China in fiscal 2014
was driven by increased sales in our Basketball and Sportswear categories,
partially offset by declines in our Men’s Training, Running, and Action Sports
NIKE, INC. 2014 Annual Report and Notice of Annual Meeting 73
FORM 10-K