Nike 2014 Annual Report Download - page 58
Download and view the complete annual report
Please find page 58 of the 2014 Nike annual report below. You can navigate through the pages in the report by either clicking on the pages listed below, or by using the keyword search tool below to find specific information within the annual report.-
 1
1 -
2
-
3
-
4
-
5
-
6
-
7
-
8
-
9
-
10
-
11
-
12
-
13
-
14
-
15
-
16
-
17
-
18
-
19
-
20
-
21
-
22
-
23
-
24
-
25
-
26
-
27
-
28
-
29
-
30
-
31
-
32
-
33
-
34
-
35
-
36
-
37
-
38
-
39
-
40
-
41
-
42
-
43
-
44
-
45
-
46
-
47
-
 48
48 -
 49
49 -
 50
50 -
 51
51 -
 52
52 -
 53
53 -
 54
54 -
 55
55 -
 56
56 -
 57
57 -
 58
58 -
 59
59 -
 60
60 -
 61
61 -
 62
62 -
 63
63 -
 64
64 -
 65
65 -
 66
66 -
 67
67 -
 68
68 -
69
-
70
-
71
-
72
-
73
-
74
-
75
-
76
-
77
-
78
-
79
-
80
-
81
-
82
-
83
-
84
-
85
-
86
 |
 |

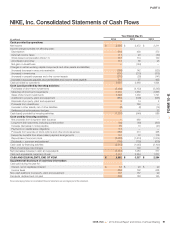
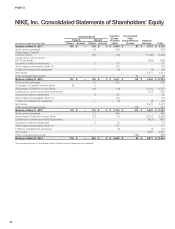
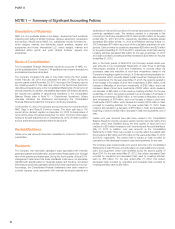
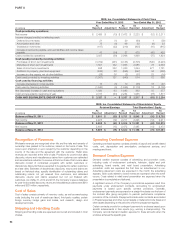
PART II
NOTE 6 — Fair Value Measurements
The following tables present information about the Company’s financial assets and liabilities measured at fair value on a recurring basis as of May 31, 2014 and
2013 and indicate the fair value hierarchy of the valuation techniques utilized by the Company to determine such fair value. Refer to Note 1 — Summary of
Significant Accounting Policies for additional detail regarding the Company’s fair value measurement methodology.
As of May 31, 2014
(In millions)
Assets at Fair
Value
Cash and Cash
Equivalents
Short-term
Investments
Other Long-term
Assets
Cash $ 780 $ 780 $ — $ —
Level 1:
U.S. Treasury securities 1,137 151 986 —
Level 2:
Time deposits 227 227 — —
U.S. Agency securities 1,027 25 1,002 —
Commercial paper and bonds 959 25 934 —
Money market funds 1,012 1,012 — —
Total level 2 3,225 1,289 1,936 —
Level 3:
Non-marketable preferred stock 7 — — 7
TOTAL $ 5,149 $ 2,220 $ 2,922 $ 7
As of May 31, 2013
(In millions)
Assets at Fair
Value
Cash and Cash
Equivalents
Short-term
Investments
Other Long-term
Assets
Cash $ 663 $ 663 $ — $ —
Level 1:
U.S. Treasury securities 2,008 425 1,583 —
Level 2:
Time deposits 358 358 — —
U.S. Agency securities(1) 1,026 395 631 —
Commercial paper and bonds(1) 1,074 660 414 —
Money market funds 836 836 — —
Total level 2 3,294 2,249 1,045 —
Level 3:
Non-marketable preferred stock 5 — — 5
TOTAL $ 5,970 $ 3,337 $ 2,628 $ 5
(1) Amounts have been revised to reflect proper classification between U.S. Agency securities and commercial paper and bonds.
As of May 31, 2014
Asset Derivatives Liability Derivatives
(In millions)
Assets
at Fair
Value
Other
Current
Assets
Other
Long-
term
Assets
Liabilities
at Fair
Value
Accrued
Liabilities
Other Long-term
Liabilities
Level 2:
Foreign exchange forwards and options(1) $ 127 $ 101 $ 26 $ 85 $ 84 $ 1
Interest rate swap contracts 6 — 6 — — —
TOTAL $ 133 $ 101 $ 32 $ 85 $ 84 $ 1
(1) The Company’s derivative financial instruments are subject to master netting arrangements that allow for the offset of assets and liabilities in the event of default or early termination of the
contract. The Company elects to record the gross assets and liabilities of its derivative financial instruments in the Consolidated Balance Sheets. If the derivative financial instruments had
been netted in the Consolidated Balance Sheets, the asset and liability positions each would have been reduced by $63 million. No material amounts of collateral were received or posted
on the Company’s derivative assets and liabilities as of May 31, 2014.
As of May 31, 2013
Asset Derivatives Liability Derivatives
(In millions)
Assets
at Fair
Value
Other
Current
Assets
Other
Long-
term
Assets
Liabilities
at Fair
Value
Accrued
Liabilities
Other Long-term
Liabilities
Level 2:
Foreign exchange forwards and options(1) $ 278 $ 199 $ 79 $ 34 $ 34 $ —
Interest rate swap contracts 11 — 11 — — —
TOTAL $ 289 $ 199 $ 90 $ 34 $ 34 $ —
(1) The Company’s derivative financial instruments are subject to master netting arrangements that allow for the offset of assets and liabilities in the event of default or early termination of the
contract. The Company elects to record the gross assets and liabilities of its derivative financial instruments in the Consolidated Balance Sheets. If the derivative financial instruments had
been netted in the Consolidated Balance Sheets, the asset and liability positions each would have been reduced by $34 million. No material amounts of collateral were received or posted
on the Company’s derivative assets and liabilities as of May 31, 2013.
NIKE, INC. 2014 Annual Report and Notice of Annual Meeting 101
FORM 10-K