Nike 2014 Annual Report Download - page 29
Download and view the complete annual report
Please find page 29 of the 2014 Nike annual report below. You can navigate through the pages in the report by either clicking on the pages listed below, or by using the keyword search tool below to find specific information within the annual report.-
 1
1 -
2
-
3
-
4
-
5
-
6
-
7
-
8
-
9
-
10
-
11
-
12
-
13
-
14
-
15
-
16
-
17
-
18
-
 19
19 -
 20
20 -
 21
21 -
 22
22 -
 23
23 -
 24
24 -
 25
25 -
 26
26 -
 27
27 -
 28
28 -
 29
29 -
 30
30 -
 31
31 -
 32
32 -
 33
33 -
 34
34 -
 35
35 -
 36
36 -
 37
37 -
 38
38 -
 39
39 -
40
-
41
-
42
-
43
-
44
-
45
-
46
-
47
-
48
-
49
-
50
-
51
-
52
-
53
-
54
-
55
-
56
-
57
-
58
-
59
-
60
-
61
-
62
-
63
-
64
-
65
-
66
-
67
-
68
-
69
-
70
-
71
-
72
-
73
-
74
-
75
-
76
-
77
-
78
-
79
-
80
-
81
-
82
-
83
-
84
-
85
-
86
 |
 |

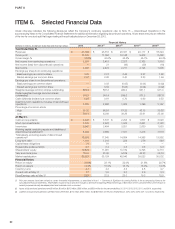
PART II
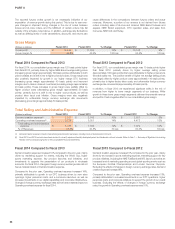
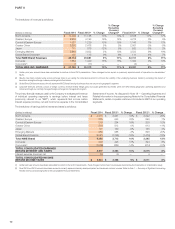
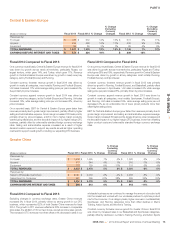
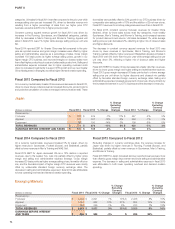
Western Europe
(Dollars in millions) Fiscal 2014 Fiscal 2013 % Change
% Change
Excluding
Currency
Changes Fiscal 2012 % Change
% Change
Excluding
Currency
Changes
Revenues by:
Footwear $ 3,299 $ 2,657 24% 20% $ 2,538 5% 10%
Apparel 1,427 1,289 11% 7% 1,407 -8% -4%
Equipment 253 247 2% -1% 267 -7% -3%
TOTAL REVENUES $ 4,979 $ 4,193 19% 14% $ 4,212 0% 5%
Revenues by:
Sales to Wholesale Customers $ 4,022 $ 3,481 16% 11% $ 3,623 -4% 1%
Sales Direct to Consumer 957 712 34% 29% 589 21% 27%
TOTAL REVENUES $ 4,979 $ 4,193 19% 14% $ 4,212 0% 5%
EARNINGS BEFORE INTEREST AND TAXES $ 855 $ 643 33% $ 599 7%
Fiscal 2014 Compared to Fiscal 2013
The ongoing implementation of the category offense in Western Europe
yielded successful results in fiscal 2014. On a currency neutral basis, all
territories in Western Europe reported revenue growth for fiscal 2014, except
Italy and Iberia, which declined 7% and 1%, respectively. Revenues for the
U.K. & Ireland and AGS (Austria, Germany, and Switzerland), our largest
territories in Western Europe, increased 20% and 23%, respectively. On a
category basis, revenue growth in fiscal 2014 was fueled by our Running,
Football (Soccer), and Sportswear categories. The growth in DTC revenues
for fiscal 2014 was driven by 17% growth in comparable store sales, rapid
growth in online sales, and the addition of 19 net new stores.
Constant currency footwear revenue growth in Western Europe reflected
increases in every key category, most notably our Sportswear, Running,
Football (Soccer), and Basketball categories. Unit sales in fiscal 2014
increased 11% and average selling price per pair increased 9%. The increase
in average price per pair was primarily the result of price increases, a shift in
mix to higher priced products, and lower discounts.
The constant currency increase in Western Europe apparel revenues was due
to increases in Football (Soccer), Running, and Women’s Training, partially
offset by a decline in Sportswear. Unit sales increased 3% while average
selling price per unit increased 4%, driven primarily by lower discounts on off-
price closeout sales compared to the prior year.
On a reported basis, Western Europe EBIT for fiscal 2014 grew at a faster rate
than revenues as a result of a 150 basis point increase in gross margin and
selling and administrative expense leverage. The gross margin increase was
fueled by higher average selling prices, growth in our higher margin DTC
business, lower discounts, and lower off-price mix, which more than offset
unfavorable standard foreign currency exchange rates and higher product
input costs. Selling and administrative expense was lower as a percentage of
revenue despite higher operating overhead costs to support growth in our
DTC business and higher demand creation spending for sports marketing to
support key events such as the World Cup.
Fiscal 2013 Compared to Fiscal 2012
On a currency neutral basis, most territories in Western Europe reported
revenue growth for fiscal 2013, which more than offset revenue declines of
17% and 18% in Italy and Iberia, respectively, reflecting poor economic
conditions in southern Europe. Revenues for the U.K. & Ireland and AGS
territories increased 8% and 12%, respectively. The growth in DTC revenues
reflected 17% growth in comparable store sales, the addition of 19 net new
stores and strong growth in online sales. On a category basis, Western
Europe’s revenues growth was largely driven by growth in our Running and
Basketball categories.
Constant currency footwear revenue growth in Western Europe was primarily
driven by growth in Running, Sportswear, and Basketball. Unit sales
increased 7% and average selling price per pair increased 3%, the latter
primarily the result of price increases.
The constant currency decrease in Western Europe apparel revenues was
due to a decline in Sportswear, partially offset by growth in Running, Men’s
Training, and Basketball. Unit sales in fiscal 2013 decreased 1% while
average selling price per unit decreased 3%, as higher discounts on closeout
sales more than offset selling price increases.
The EBIT growth in fiscal 2013 was driven by a 200 basis point increase in
gross margin, partially offset by higher selling and administrative expenses.
The gross margin increase was primarily driven by favorable standard foreign
currency exchange rates; higher net average selling prices were mostly offset
by higher product costs. The increase in selling and administrative expense
was mainly driven by an increased level of demand creation spending around
the European Football Championships and Olympics in the first quarter of
fiscal 2013, as well as higher sports marketing expense. Additionally,
operating overhead costs increased to support the expansion of our DTC
business and overall growth of the business. Fiscal 2013 EBIT growth for
Western Europe was also increased by a $24 million, one-time restructuring
charge that was recorded in Other expense (income), net, in the fourth quarter
of fiscal 2012.
72