Nike 2014 Annual Report Download - page 27
Download and view the complete annual report
Please find page 27 of the 2014 Nike annual report below. You can navigate through the pages in the report by either clicking on the pages listed below, or by using the keyword search tool below to find specific information within the annual report.-
 1
1 -
2
-
3
-
4
-
5
-
6
-
7
-
8
-
9
-
10
-
11
-
12
-
13
-
14
-
15
-
16
-
 17
17 -
 18
18 -
 19
19 -
 20
20 -
 21
21 -
 22
22 -
 23
23 -
 24
24 -
 25
25 -
 26
26 -
 27
27 -
 28
28 -
 29
29 -
 30
30 -
 31
31 -
 32
32 -
 33
33 -
 34
34 -
 35
35 -
 36
36 -
 37
37 -
38
-
39
-
40
-
41
-
42
-
43
-
44
-
45
-
46
-
47
-
48
-
49
-
50
-
51
-
52
-
53
-
54
-
55
-
56
-
57
-
58
-
59
-
60
-
61
-
62
-
63
-
64
-
65
-
66
-
67
-
68
-
69
-
70
-
71
-
72
-
73
-
74
-
75
-
76
-
77
-
78
-
79
-
80
-
81
-
82
-
83
-
84
-
85
-
86
 |
 |

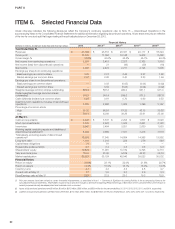
PART II
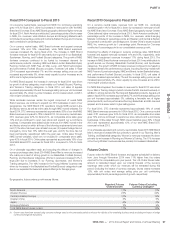
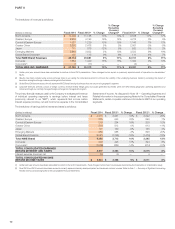
Thebreakdownofrevenuesisasfollows:
(Dollars in millions) Fiscal 2014 Fiscal 2013(1) % Change
% Change
Excluding
Currency
Changes(2) Fiscal 2012(1) % Change
% Change
Excluding
Currency
Changes(2)
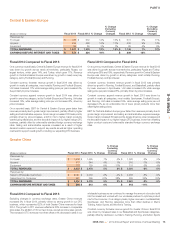
North America $ 12,299 $ 11,158 10% 10% $ 9,538 17% 17%
Western Europe 4,979 4,193 19% 14% 4,212 0% 5%
Central & Eastern Europe 1,387 1,229 13% 15% 1,146 7% 12%
Greater China 2,602 2,478 5% 3% 2,561 -3% -5%
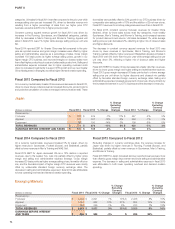
Japan 771 876 -12% 5% 920 -5% 2%
Emerging Markets 3,949 3,832 3% 13% 3,523 9% 16%
Global Brand Divisions(3) 125 115 9% 6% 111 4% 7%
Total NIKE Brand Revenues 26,112 23,881 9% 11% 22,011 8% 11%
Converse 1,684 1,449 16% 15% 1,324 9% 10%
Corporate(4) 3 (17) — — (4) — —
TOTAL NIKE, INC. REVENUES $ 27,799 $ 25,313 10% 11% $ 23,331 8% 11%
(1) Certain prior year amounts have been reclassified to conform to fiscal 2014 presentation. These changes had no impact on previously reported results of operations or shareholders’
equity.
(2) Results have been restated using actual exchange rates in use during the comparative period to enhance the visibility of the underlying business trends by excluding the impact of
translation arising from foreign currency exchange rate fluctuations.
(3) Global Brand Divisions revenues primarily represent NIKE Brand licensing businesses that are not part of a geographic segment.
(4) Corporate revenues primarily consist of foreign currency revenue-related hedge gains and losses generated by entities within the NIKE Brand geographic operating segments and
Converse through our centrally managed foreign exchange risk management program.
The primary financial measure used by the Company to evaluate performance
of individual operating segments is earnings before interest and taxes
(commonly referred to as “EBIT”), which represents Net income before
Interest expense (income), net and Income tax expense in the Consolidated
Statements of Income. As discussed in Note 18 — Operating Segments and
Related Information in the accompanying Notes to the Consolidated Financial
Statements, certain corporate costs are not included in EBIT of our operating
segments.
The breakdown of earnings before interest and taxes is as follows:
(Dollars in millions) Fiscal 2014 Fiscal 2013(1) % Change Fiscal 2012(1) % Change
North America $ 3,075 $ 2,641 16% $ 2,092 26%
Western Europe 855 643 33% 599 7%
Central & Eastern Europe 279 234 19% 209 12%
Greater China 816 813 0% 913 -11%
Japan 131 139 -6% 135 3%
Emerging Markets 955 988 -3% 826 20%
Global Brand Divisions (2,021) (1,746) -16% (1,479) -18%
Total NIKE Brand 4,090 3,712 10% 3,295 13%
Converse 496 425 17% 394 8%
Corporate(2) (1,009) (884) -14% (674) -31%
TOTAL CONSOLIDATED EARNINGS
BEFORE INTEREST AND TAXES 3,577 3,253 10% 3,015 8%
Interest expense (income), net 33 (3) — 4 —
TOTAL CONSOLIDATED INCOME
BEFORE INCOME TAXES $ 3,544 $ 3,256 9% $ 3,011 8%
(1) Certain prior year amounts have been reclassified to conform to fiscal 2014 presentation. These changes had no impact on previously reported results of operations or shareholders’ equity.
(2) Fiscal 2013 and 2012 amounts have been revised to correctly expense internally developed patent and trademark costs as incurred. Refer to Note 1 — Summary of Significant Accounting
Policies in the accompanying Notes to the Consolidated Financial Statements.
70