Nike 2014 Annual Report Download - page 28
Download and view the complete annual report
Please find page 28 of the 2014 Nike annual report below. You can navigate through the pages in the report by either clicking on the pages listed below, or by using the keyword search tool below to find specific information within the annual report.-
 1
1 -
2
-
3
-
4
-
5
-
6
-
7
-
8
-
9
-
10
-
11
-
12
-
13
-
14
-
15
-
16
-
17
-
 18
18 -
 19
19 -
 20
20 -
 21
21 -
 22
22 -
 23
23 -
 24
24 -
 25
25 -
 26
26 -
 27
27 -
 28
28 -
 29
29 -
 30
30 -
 31
31 -
 32
32 -
 33
33 -
 34
34 -
 35
35 -
 36
36 -
 37
37 -
 38
38 -
39
-
40
-
41
-
42
-
43
-
44
-
45
-
46
-
47
-
48
-
49
-
50
-
51
-
52
-
53
-
54
-
55
-
56
-
57
-
58
-
59
-
60
-
61
-
62
-
63
-
64
-
65
-
66
-
67
-
68
-
69
-
70
-
71
-
72
-
73
-
74
-
75
-
76
-
77
-
78
-
79
-
80
-
81
-
82
-
83
-
84
-
85
-
86
 |
 |

PART II
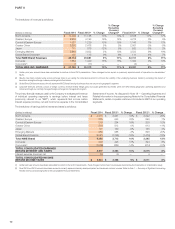
North America
(Dollars in millions) Fiscal 2014 Fiscal 2013 % Change
% Change
Excluding
Currency
Changes Fiscal 2012 % Change
% Change
Excluding
Currency
Changes
Revenues by:
Footwear $ 7,495 $ 6,751 11% 11% $ 5,941 14% 14%
Apparel 3,937 3,591 10% 10% 2,993 20% 20%
Equipment 867 816 6% 6% 604 35% 35%
TOTAL REVENUES $ 12,299 $ 11,158 10% 10% $ 9,538 17% 17%
Revenues by:
Sales to Wholesale Customers $ 9,296 $ 8,571 8% 9% $ 7,385 16% 16%
Sales Direct to Consumer 3,003 2,587 16% 16% 2,153 20% 20%
TOTAL REVENUES $ 12,299 $ 11,158 10% 10% $ 9,538 17% 17%
EARNINGS BEFORE INTEREST
AND TAXES $ 3,075 $ 2,641 16% $ 2,092 26%
Fiscal 2014 Compared to Fiscal 2013
Our continued focus on the category offense drove increased demand for
NIKE Brand products across all key categories for fiscal 2014. Our Basketball,
Men’s Training, Running, and Sportswear categories fueled the revenue
growth in fiscal 2014. DTC revenue growth in North America for fiscal 2014
was driven by a 7% increase in comparable store sales, the addition of 16 net
new stores, and strong online sales growth.
Footwear revenue growth in North America was driven by higher demand in
nearly all key categories, led by our Basketball, Running, and Sportswear
categories. For fiscal 2014, unit sales increased 7% and average selling price
per pair increased 4%. The increase in average selling price per pair was
driven by price increases and shift in mix toward higher priced products in
nearly equal amounts.
North America apparel revenue growth was fueled by higher demand in all
key categories, most notably our Men’s Training, Women’s Training, and
Sportswear categories. Both unit sales and average selling price per unit
increased, with unit sales increasing 6% and average selling price per unit
increasing 4%. The increase in average selling price per unit was primarily
driven by price increases, and to a lesser extent, a change in mix to higher
priced products.
North America EBIT increased at a faster rate than revenues due to gross
margin expansion and slight selling and administrative expense leverage.
Gross margin increased 120 basis points for fiscal 2014, reflecting pricing
initiatives as well as lower product costs as a result of favorable changes in
product mix. These gross margin benefits were partially offset by higher off-
price mix. Selling and administrative expenses grew in line with revenues as a
result of higher operating overhead costs to support DTC growth and higher
demand creation expense in support of the World Cup and key product and
brand initiatives.
Fiscal 2013 Compared to Fiscal 2012
Our category offense continued to deliver innovative products, deep brand
connections, and compelling retail experiences to consumers in North
America, driving increased demand for NIKE Brand products across all key
categories except Action Sports. Our Basketball, Men’s Training, Running,
and Sportswear categories drove the revenue growth in fiscal 2013. North
America’s DTC revenue growth for fiscal 2013 was fueled by 15% growth in
comparable store sales as well as the addition of new stores and rapid growth
in online sales.
North America footwear revenue growth was driven by higher demand in all
key categories, most notably Basketball, Running, and Sportswear. Both unit
sales and average selling price per pair increased 7% in fiscal 2013. The
increase in average selling price per pair was driven approximately equally by
price increases and a favorable mix of higher priced products.
Apparel revenue growth in North America was driven by higher demand in our
Men’s Training category, reflecting the addition of the NFL licensed business,
as well as Basketball, Women’s Training, and Running. Unit sales increased
9% while average selling price per unit increased 11%, largely driven by a
favorable mix of higher priced products.
North America EBIT increased faster than revenues due to gross margin
expansion and selling and administrative expense leverage. Gross margin
increased 50 basis points for fiscal 2013, reflecting the favorable impact of
selling price increases, partially offset by higher product costs, an unfavorable
mix of lower margin products, and royalties for the NFL business. Selling and
administrative expenses increased versus fiscal 2012, though at a rate slower
than revenues; the growth was largely driven by higher demand creation
expense for the Olympics in the first quarter of fiscal 2013 as well as key
product initiatives, including the NFL launch, and higher operating overhead
costs to support the expansion of our DTC business and overall growth of the
business.
NIKE, INC. 2014 Annual Report and Notice of Annual Meeting 71
FORM 10-K