Nike 2014 Annual Report Download - page 31
Download and view the complete annual report
Please find page 31 of the 2014 Nike annual report below. You can navigate through the pages in the report by either clicking on the pages listed below, or by using the keyword search tool below to find specific information within the annual report.-
 1
1 -
2
-
3
-
4
-
5
-
6
-
7
-
8
-
9
-
10
-
11
-
12
-
13
-
14
-
15
-
16
-
17
-
18
-
19
-
20
-
 21
21 -
 22
22 -
 23
23 -
 24
24 -
 25
25 -
 26
26 -
 27
27 -
 28
28 -
 29
29 -
 30
30 -
 31
31 -
 32
32 -
 33
33 -
 34
34 -
 35
35 -
 36
36 -
 37
37 -
 38
38 -
 39
39 -
 40
40 -
 41
41 -
42
-
43
-
44
-
45
-
46
-
47
-
48
-
49
-
50
-
51
-
52
-
53
-
54
-
55
-
56
-
57
-
58
-
59
-
60
-
61
-
62
-
63
-
64
-
65
-
66
-
67
-
68
-
69
-
70
-
71
-
72
-
73
-
74
-
75
-
76
-
77
-
78
-
79
-
80
-
81
-
82
-
83
-
84
-
85
-
86
 |
 |

PART II
categories. Unit sales for fiscal 2014 were flat compared to the prior year while
average selling price per pair increased 5%, driven by favorable revenue mix
resulting from a higher percentage of sales from our higher price DTC
business, as well as a shift in mix to higher priced product.
Constant currency apparel revenue growth for fiscal 2014 was driven by
increases in the Running, Sportswear, and Basketball categories, partially
offset by decreases in Men’s Training and Women’s Training. Apparel unit
sales in fiscal 2014 were 1% higher while average selling price per unit was
flat.
Fiscal 2014 reported EBIT for Greater China was flat compared to the prior
year as reported revenue and gross margin increases were offset by higher
selling and administrative expense as a percentage of sales. Gross margin
increased 150 basis points as higher average selling prices, growth in our
higher margin DTC business, and improved margins on closeout sales more
than offset higher product input costs and unfavorable product mix. Selling and
administrative expense increased due to higher operating overhead costs
driven by increased investments to support DTC growth and our new Greater
China headquarters in Shanghai, as well as higher demand creation spending.
Fiscal 2013 Compared to Fiscal 2012
On a currency neutral basis, Greater China revenues decreased in fiscal 2013,
driven by lower futures orders as well as increased discounts, product returns
and proactive cancellation of orders to manage inventory levels at retail. These
downsides were partially offset by 33% growth in our DTC business driven by
comparable store sales growth of 13% and the addition of 29 net new stores.
Fiscal 2013 revenues for most key categories were lower than in fiscal 2012.
For fiscal 2013, constant currency footwear revenues for Greater China
declined, driven by lower sales across most key categories, most notably
Sportswear, Men’s Training, and Women’s Training; and increased reserves
for product discounts and returns. Unit sales decreased 1%, while average
selling price per pair decreased 2%, reflecting a higher mix of closeout sales
and higher discounts.
The decrease in constant currency apparel revenues for fiscal 2013 was
driven by lower revenues in Sportswear, Men’s Training, and Women’s
Training, partially offset by higher revenues in Basketball. Apparel unit sales in
fiscal 2013 were 3% lower than the prior year while average selling price per
unit was down 5%, reflecting a higher mix of closeout sales and higher
discounts.
Fiscal 2013 EBIT for Greater China decreased at a faster rate than revenues,
driven by lower gross margin and higher selling and administrative expense.
Fiscal 2013 gross margin decreased 50 basis points due to a lower average
selling price per unit driven by higher discounts and closeout mix partially
offset by favorable standard foreign currency exchange rates. Selling and
administrative expense increased as a percent of revenues, driven primarily by
the increased investment in our DTC business and the decrease in revenues.
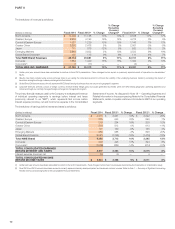
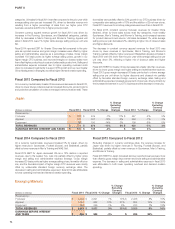
Japan
(Dollars in millions) Fiscal 2014 Fiscal 2013 % Change
% Change
Excluding
Currency
Changes Fiscal 2012 % Change
%Change
Excluding
Currency
Changes
Revenues by:
Footwear $ 409 $ 439 -7% 11% $ 447 -2% 5%
Apparel 276 337 -18% -2% 364 -7% -1%
Equipment 86 100 -14% 2% 109 -8% 0%
TOTAL REVENUES $ 771 $ 876 -12% 5% $ 920 -5% 2%
EARNINGS BEFORE INTEREST AND TAXES $ 131 $ 139 -6% $ 135 3%
Fiscal 2014 Compared to Fiscal 2013
On a currency neutral basis, revenues increased 5% for Japan, driven by
higher revenues in Sportswear, Football (Soccer), and Basketball, partially
offset by lower revenues in Men’s Training and NIKE Golf.
Fiscal 2014 EBIT for Japan decreased 6% as a 12% decline in reported
revenues, due to the weaker Yen, was only partially offset by higher gross
margin and selling and administrative expense leverage. Gross margin
increased 20 basis points as higher average selling prices, favorable off-price
mix, and the favorable impact of higher margin DTC revenues were mostly
offset by unfavorable standard foreign currency exchange rates. The
decrease in selling and administrative expense in fiscal 2014 was attributable
to lower operating overhead and demand creation spending.
Fiscal 2013 Compared to Fiscal 2012
Excluding changes in currency exchange rates, the revenue increase for
Japan was driven by higher revenues in Running, Football (Soccer), and
Basketball, partially offset by lower revenues in Sportswear, Men’s Training,
and Women’s Training.
Fiscal 2013 EBIT for Japan increased as lower reported revenues were more
than offset by gross margin improvement and lower selling and administrative
expense. The decrease in selling and administrative expense in fiscal 2013
was attributable to both lower operating overhead and demand creation
spending.
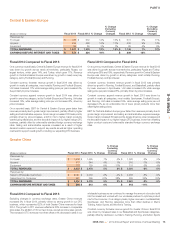
Emerging Markets
(Dollars in millions) Fiscal 2014 Fiscal 2013 % Change
% Change
Excluding
Currency
Changes Fiscal 2012 % Change
% Change
Excluding
Currency
Changes
Revenues by:
Footwear $ 2,642 $ 2,621 1% 10% $ 2,436 8% 15%
Apparel 1,061 962 10% 21% 854 13% 19%
Equipment 246 249 -1% 9% 233 7% 13%
TOTAL REVENUES $ 3,949 $ 3,832 3% 13% $ 3,523 9% 16%
EARNINGS BEFORE INTEREST
AND TAXES $ 955 $ 988 -3% $ 826 20%
74