Nike 2014 Annual Report Download - page 25
Download and view the complete annual report
Please find page 25 of the 2014 Nike annual report below. You can navigate through the pages in the report by either clicking on the pages listed below, or by using the keyword search tool below to find specific information within the annual report.-
 1
1 -
2
-
3
-
4
-
5
-
6
-
7
-
8
-
9
-
10
-
11
-
12
-
13
-
14
-
 15
15 -
 16
16 -
 17
17 -
 18
18 -
 19
19 -
 20
20 -
 21
21 -
 22
22 -
 23
23 -
 24
24 -
 25
25 -
 26
26 -
 27
27 -
 28
28 -
 29
29 -
 30
30 -
 31
31 -
 32
32 -
 33
33 -
 34
34 -
 35
35 -
36
-
37
-
38
-
39
-
40
-
41
-
42
-
43
-
44
-
45
-
46
-
47
-
48
-
49
-
50
-
51
-
52
-
53
-
54
-
55
-
56
-
57
-
58
-
59
-
60
-
61
-
62
-
63
-
64
-
65
-
66
-
67
-
68
-
69
-
70
-
71
-
72
-
73
-
74
-
75
-
76
-
77
-
78
-
79
-
80
-
81
-
82
-
83
-
84
-
85
-
86
 |
 |

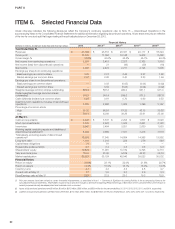
PART II
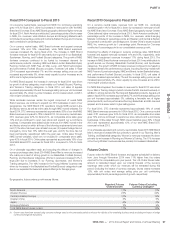
The reported futures orders growth is not necessarily indicative of our
expectation of revenue growth during this period. This is due to year-over-
year changes in shipment timing, changes in the mix of orders between
futures and at-once orders, and the fulfillment of certain orders may fall
outside of the schedule noted above. In addition, exchange rate fluctuations
as well as differing levels of order cancellations, discounts, and returns can
cause differences in the comparisons between futures orders and actual
revenues. Moreover, a portion of our revenue is not derived from futures
orders, including sales of at-once and closeout NIKE Brand footwear and
apparel, NIKE Brand equipment, DTC operation sales, and sales from
Converse, NIKE Golf, and Hurley.
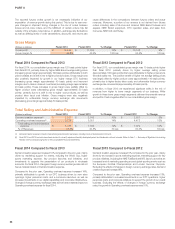
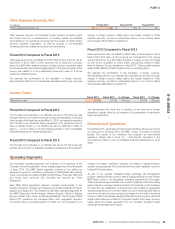
Gross Margin
(Dollars in millions) Fiscal 2014 Fiscal 2013 % Change Fiscal 2012 % Change
Gross profit $ 12,446 $ 11,034 13% $ 10,148 9%
Gross margin % 44.8% 43.6% 120 bps 43.5% 10 bps
Fiscal 2014 Compared to Fiscal 2013
For fiscal 2014, our consolidated gross margin was 120 basis points higher
than fiscal 2013, primarily driven by higher NIKE Brand average selling prices
(increasing gross margin approximately 160 basis points), attributable to both
price increases and a shift in mix to higher priced products. Gross margin was
also positively impacted by growth in our higher margin DTC business
(increasing gross margin approximately 40 basis points) and improved
margins due to cleaner closeout inventories (increasing margin approximately
20 basis points). These increases in gross margin were partially offset by
higher product costs (decreasing gross margin approximately 50 basis
points), primarily due to a shift in mix to higher cost products, as well as
product labor input cost inflation. Gross margins were also negatively
impacted by unfavorable foreign currency exchange rate movements
(decreasing gross margin approximately 50 basis points).
Fiscal 2013 Compared to Fiscal 2012
For fiscal 2013, our consolidated gross margin was 10 basis points higher
than fiscal 2012, primarily driven by higher average selling prices
(approximately 160 basis points) that were attributable to higher prices and a
favorable sales mix. The positive benefit of higher net average selling prices
was largely offset by higher product costs (approximately 110 basis points),
primarily due to higher factory labor costs, and unfavorable foreign currency
exchange rate movements (approximately 40 basis points).
In addition, in fiscal 2013 we experienced significant shifts in the mix of
revenues from higher to lower margin segments of our business. While
growth in these lower gross margin segments delivered incremental revenue
and profits, it had a negative effect on our consolidated gross margin.
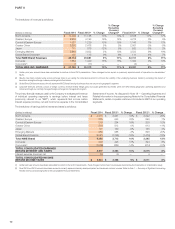
Total Selling and Administrative Expense
(Dollars in millions) Fiscal 2014 Fiscal 2013 % Change Fiscal 2012 % Change
Demand creation expense(1) $ 3,031 $ 2,745 10% $ 2,607 5%
Operating overhead expense(2) 5,735 5,051 14% 4,472 13%
Total selling and administrative
expense $ 8,766 $ 7,796 12% $ 7,079 10%
% of Revenues 31.5% 30.8% 70 bps 30.3% 50 bps
(1) Demand creation expense consists of advertising and promotion expenses, including costs of endorsement contracts.
(2) Fiscal 2013 and 2012 amounts have been revised to correctly expense internally developed patent and trademark costs as incurred. Refer to Note 1 — Summary of Significant Accounting
Policies in the accompanying Notes to the Consolidated Financial Statements.
Fiscal 2014 Compared to Fiscal 2013
Demand creation expense increased 10% compared to the prior year, mainly
driven by marketing support for events, including the World Cup, higher
sports marketing expense, key product launches and initiatives, and
investments to upgrade the presentation of our products in wholesale
accounts. For fiscal 2014, changes in foreign currency exchange rates did not
have a material impact on Demand creation expense.
Compared to the prior year, Operating overhead expense increased 14%,
primarily attributable to growth in our DTC business driven by new store
openings, higher personnel costs, and e-commerce launches, as well as
increased investments in our digital capabilities and corporate infrastructure.
Changes in foreign currency exchange rates did not have a material impact on
Operating overhead expense for fiscal 2014.
Fiscal 2013 Compared to Fiscal 2012
Demand creation expense increased 5% compared to the prior year, mainly
driven by an increase in sports marketing expense, marketing support for key
product initiatives, including the NIKE FuelBand and NFL launch, as well as an
increased level of marketing spending around global sporting events such as
the European Football Championships and London Summer Olympics.
Excluding the effects of changes in foreign currency exchange rates, Demand
creation expense increased 8%.
Compared to the prior year, Operating overhead expense increased 13%,
primarily attributable to increased investments in our DTC operations, higher
personnel costs, and corporate initiatives to support the growth of our overall
business. Excluding the effects of changes in foreign currency exchange
rates, the growth in Operating overhead expense was 15%.
68