Proctor and Gamble 2009 Annual Report Download - page 39
Download and view the complete annual report
Please find page 39 of the 2009 Proctor and Gamble annual report below. You can navigate through the pages in the report by either clicking on the pages listed below, or by using the keyword search tool below to find specific information within the annual report.-
 1
1 -
2
-
3
-
4
-
5
-
6
-
7
-
8
-
9
-
10
-
11
-
12
-
13
-
14
-
15
-
16
-
17
-
18
-
19
-
20
-
21
-
22
-
23
-
24
-
25
-
26
-
27
-
28
-
 29
29 -
 30
30 -
 31
31 -
 32
32 -
 33
33 -
 34
34 -
 35
35 -
 36
36 -
 37
37 -
 38
38 -
 39
39 -
 40
40 -
 41
41 -
 42
42 -
 43
43 -
 44
44 -
 45
45 -
 46
46 -
 47
47 -
 48
48 -
 49
49 -
50
-
51
-
52
-
53
-
54
-
55
-
56
-
57
-
58
-
59
-
60
-
61
-
62
-
63
-
64
-
65
-
66
-
67
-
68
-
69
-
70
-
71
-
72
-
73
-
74
-
75
-
76
-
77
-
78
 |
 |

Management’s Discussion and Analysis The Procter & Gamble Company 37
the current year, net adjustments to reserves for uncertain tax positions
benefitted the effective tax rate by 120 basis points, versus a benefit
of 320 basis points in 2008. The effective tax rate from continuing
operations declined from 29.5% in 2007 to 24.5% in 2008.
Approximately 300 basis points of the decline was due to the tax
reserve adjustments for previously existing uncertain tax positions.
The balance of the decline in 2008 was primarily driven by a more
favorable geographic mix of earnings and a reduction in the German
statutory tax rate, which reduced our deferred tax liabilities related to
acquired intangible assets.
Net Earnings
Net earnings from continuing operations decreased 4% to $11.3billion
in 2009 mainly due to lower net sales and a higher effective tax rate.
Operating margin was consistent with the prior year as lower SG&A
as a percentage of net sales offset a commodity-driven decline in
gross margin. Net earnings from continuing operations in 2008
increased 17% to $11.8billion behind sales growth, a 40-basis point
improvement in operating margin and a lower tax rate. Operating
margin increased in 2008 due to lower SG&A as a percentage of net
sales, which more than offset lower gross margin.
Net earnings from discontinued operations increased $1.9billion in
2009 primarily due to a $2.0billion after tax gain on the sale of the
Coffee business in November 2008. This was partially offset by the loss
of earnings contribution from the Coffee business. Net earnings from
discontinued operations were $277 million in both 2008 and 2007.
Diluted net earnings per share in 2009 increased 17% to $4.26. The
increase was due mainly to the gain on the sale of our Coffee business,
partially offset by lower net earnings from continuing operations and
the loss of earnings contribution from the Coffee business. Diluted
net earnings per share from continuing operations in 2009 increased
1% to $3.58, while diluted net earnings per share from discontinued
operations was $0.68, comprised primarily of the gain on the sale
of the Coffee business. Diluted net earnings per share growth
exceeded net earnings due to fewer shares outstanding as a result of
share repurchase activity and shares tendered in the Folgers coffee
transaction. Treasury shares in the amount of $6.4billion were
repurchased in 2009, nearly all of which were made under our publicly
announced share repurchase program.
Diluted net earnings per share in 2008 were up 20% versus the prior
year to $3.64 per share, comprised of $3.56 per share from continuing
operations and $0.08 per share from discontinued operations. Diluted
net earnings per share growth exceeded net earnings growth due to
share repurchase activity. Treasury shares in the amount of $10.0billion
were repurchased in 2008, nearly all of which were made under our
publicly announced share repurchase program. Gillette was modestly
accretive to earnings per share results in 2008, compared to dilution
of approximately $0.10–$0.12 per share in 2007. The elimination of
Gillette dilution on earnings per share drove approximately 4 percentage
points of earnings per share growth in 2008.
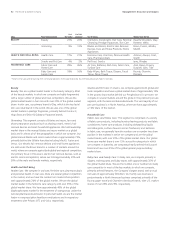
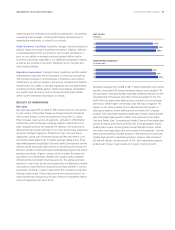
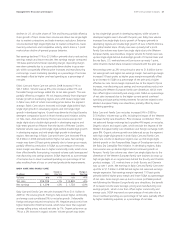
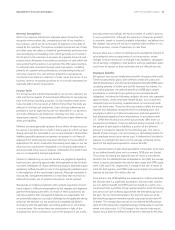
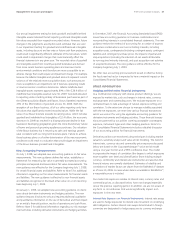
$3.04
$4.26
$3.64
07
09
08
DILUTED NET EARNINGS
(per common share)
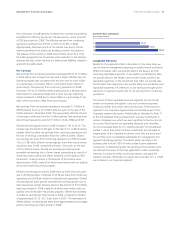
SEGMENT RESULTS
Results for the segments reflect information on the same basis we
use for internal management reporting and performance evaluation.
Within the Beauty GBU, we provide data for the Beauty and the
Grooming reportable segments. In the Health and Well-Being GBU,
we provide data for the Health Care and the Snacks and Pet Care
reportable segments. In the Household Care GBU, we provide data
for the Fabric Care and Home Care and the Baby Care and Family Care
reportable segments. All references to net earnings throughout the
discussion of segment results refer to net earnings from continuing
operations.
The results of these reportable business segments do not include
certain non-business unit specific costs such as interest expense,
investing activities and certain restructuring costs. These costs are
reported in our Corporate segment and are included as part of our
Corporate segment discussion. Additionally, as described in Note 11
to the Consolidated Financial Statements, we have investments in
certain companies over which we exert significant influence, but do
not control the financial and operating decisions and, therefore,
do not consolidate them for U.S. GAAP purposes (“unconsolidated
entities”). Given that certain of these investments are managed as
integral parts of the Company’s business units, they are accounted
for as if they were consolidated subsidiaries for management and
segment reporting purposes. This means pretax earnings in the
business units include 100% of each pretax income statement
component. In determining after-tax earnings in the business units,
we eliminate the share of earnings applicable to other ownership
interests, in a manner similar to minority interest, and apply the
statutory tax rates. Eliminations to adjust each line item to U.S. GAAP
are included in our Corporate segment.