Proctor and Gamble 2009 Annual Report Download - page 50
Download and view the complete annual report
Please find page 50 of the 2009 Proctor and Gamble annual report below. You can navigate through the pages in the report by either clicking on the pages listed below, or by using the keyword search tool below to find specific information within the annual report.-
 1
1 -
2
-
3
-
4
-
5
-
6
-
7
-
8
-
9
-
10
-
11
-
12
-
13
-
14
-
15
-
16
-
17
-
18
-
19
-
20
-
21
-
22
-
23
-
24
-
25
-
26
-
27
-
28
-
29
-
30
-
31
-
32
-
33
-
34
-
35
-
36
-
37
-
38
-
39
-
 40
40 -
 41
41 -
 42
42 -
 43
43 -
 44
44 -
 45
45 -
 46
46 -
 47
47 -
 48
48 -
 49
49 -
 50
50 -
 51
51 -
 52
52 -
 53
53 -
 54
54 -
 55
55 -
 56
56 -
 57
57 -
 58
58 -
 59
59 -
 60
60 -
61
-
62
-
63
-
64
-
65
-
66
-
67
-
68
-
69
-
70
-
71
-
72
-
73
-
74
-
75
-
76
-
77
-
78
 |
 |

48 The Procter & Gamble Company Management’s Discussion and Analysis
rate movements on our investments in foreign operations. These
currency interest rate swaps are designated as hedges of the Company’s
foreign net investments.
Based on our overall interest rate exposure as of and during the year
ended June 30, 2009, including derivative and other instruments
sensitive to interest rates, we believe a near-term change in interest
rates, at a 95% confidence level based on historical interest rate
movements, would not materially affect our financial statements.
Currency Rate Exposure on Financial Instruments. Because we
manufacture and sell products in a number of countries throughout
the world, we are exposed to the impact on revenue and expenses of
movements in currency exchange rates. The primary purpose of our
currency hedging activities is to reduce the risk that our financial
position will be adversely affected by short-term changes in exchange
rates. Corporate policy prescribes the range of allowable hedging
activity. We primarily use forward contracts with maturities of less than
18 months. In addition, we enter into certain currency swaps with
maturities of up to five years to hedge our exposure to exchange rate
movements on intercompany financing transactions.
Based on our overall currency rate exposure as of and during the year
ended June 30, 2009, we believe, at a 95% confidence level based
on historical currency rate movements, the impact of a near-term
change in currency rates on derivative and other instruments would
not materially affect our financial statements.
Commodity Price Exposure on Financial Instruments. We use raw
materials that are subject to price volatility caused by weather, supply
conditions, political and economic variables and other unpredictable
factors. In addition to fixed price contracts, we use futures, options
and swap contracts to manage the volatility related to the above
exposures.
Based on our overall commodity price exposure as of and during the
year ended June 30, 2009, we believe, at a 95% confidence level
based on historical commodity price movements, the impact of a
near-term change in commodity prices on derivative and other
instruments would not materially affect our financial statements.
Measures Not Defined By U.S. GAAP
Our discussion of financial results includes several “non-GAAP”
financial measures. We believe these measures provide our investors
with additional information about our underlying results and trends, as
well as insight to some of the metrics used to evaluate management.
When used in MD&A, we have provided the comparable GAAP
measure in the discussion. These measures include:
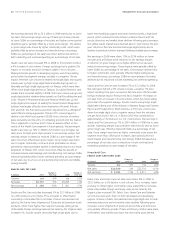
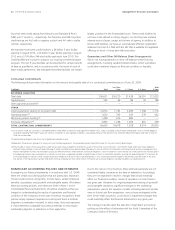
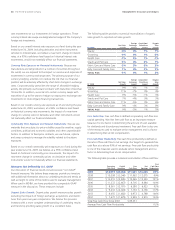
Organic Sales Growth. Organic sales growth measures sales growth
excluding the impacts of foreign exchange, acquisitions and divesti-
tures from year-over-year comparisons. We believe this provides
investors with a more complete understanding of underlying results
and trends by providing sales growth on a consistent basis.
The following tables provide a numerical reconciliation of organic
sales growth to reported net sales growth:
FY 2009
Net Sales
Growth
Foreign
Exchange
Impact
Acquisition/
Divestiture
Impact
Organic
Sales
Growth
Beauty -4% 4% 1% 1%
Grooming -9% 6% 1% -2%
Health Care-7% 5% 1% -1%
Snacks and Pet Care-3% 4% 0% 1%
Fabric Care and Home Care-2% 5% 0% 3%
Baby Care and Family Care1% 4% 2% 7%
TOTAL P&G -3% 4% 1% 2%
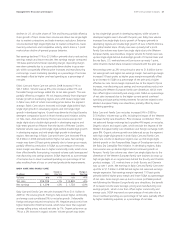
FY 2008
Net Sales
Growth
Foreign
Exchange
Impact
Acquisition/
Divestiture
Impact
Organic
Sales
Growth
Beauty 9% -6% 1% 4%
Grooming 11% -7% 0% 4%
Health Care9% -5% -1% 3%
Snacks and Pet Care7% -4% 0% 3%
Fabric Care and Home Care11% -5% 0% 6%
Baby Care and Family Care9% -4% 3% 8%
TOTAL P&G 9% -5% 1% 5%
Free Cash Flow.Free cash flow is defined as operating cash flow less
capital spending. We view free cash flow as an important measure
because it is one factor in determining the amount of cash available
for dividends and discretionary investment. Free cash flow is also one
of the measures used to evaluate senior management and is a factor
in determining their at-risk compensation.
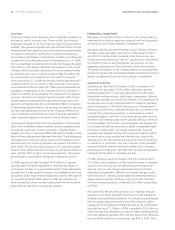
Free Cash Flow Productivity. Free cash flow productivity is defined as
the ratio of free cash flow to net earnings. Our target is to generate free
cash flow at or above 90% of net earnings. Free cash flow productivity
is one of the measures used to evaluate senior management and is a
factor in determining their at-risk compensation.
The following table provides a numerical reconciliation of free cash flow:
Operating
Cash Flow
Capital
Spending
Free
Cash Flow
Net
Earnings
Free
Cash Flow
Productivity
2009 $14,919 $(3,238) $11,681 $13,436 87%
2008 $15,008 $(3,046) $ 11,962 $12,075 99%
2007 $13,410 $(2,945) $ 10,465 $10,340 101%
2006 $11,372 $(2,667) $ 8,705 $8,684 100%
2005 $8,561 $(2,181) $ 6,380 $6,923 92%
2004 $9,216 $(2,024) $ 7,192 $6,156 117%
2003 $8,455 $(1,482) $ 6,973 $4,788 146%
2002 $7,672 $(1,679) $ 5,993 $3,910 153%
Total Free Cash Flow Since 2001 $69,351
Average Free Cash Flow Productivity 112%