Proctor and Gamble 2009 Annual Report Download - page 72
Download and view the complete annual report
Please find page 72 of the 2009 Proctor and Gamble annual report below. You can navigate through the pages in the report by either clicking on the pages listed below, or by using the keyword search tool below to find specific information within the annual report.-
 1
1 -
2
-
3
-
4
-
5
-
6
-
7
-
8
-
9
-
10
-
11
-
12
-
13
-
14
-
15
-
16
-
17
-
18
-
19
-
20
-
21
-
22
-
23
-
24
-
25
-
26
-
27
-
28
-
29
-
30
-
31
-
32
-
33
-
34
-
35
-
36
-
37
-
38
-
39
-
40
-
41
-
42
-
43
-
44
-
45
-
46
-
47
-
48
-
49
-
50
-
51
-
52
-
53
-
54
-
55
-
56
-
57
-
58
-
59
-
60
-
61
-
 62
62 -
 63
63 -
 64
64 -
 65
65 -
 66
66 -
 67
67 -
 68
68 -
 69
69 -
 70
70 -
 71
71 -
 72
72 -
 73
73 -
 74
74 -
 75
75 -
 76
76 -
 77
77 -
 78
78
 |
 |

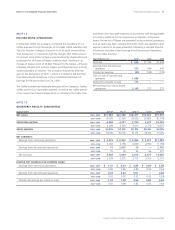
70 The Procter & Gamble Company Notes to Consolidated Financial Statements
Amounts in millions of dollars except per share amounts or as otherwise specified.
Accordingly, these partially owned operations are reflected as consoli-
dated subsidiaries in segment results, with 100% recognition of the
individual income statement line items through before-tax earnings.
Eliminations to adjust these line items to U.S. GAAP are included in
Corporate. In determining after-tax earnings for the businesses, we
eliminate the share of earnings applicable to other ownership interests,
in a manner similar to minority interest and apply statutory tax rates.
Adjustments to arrive at our effective tax rate are also included in
Corporate.
Corporate includes certain operating and non-operating activities that
are not reflected in the operating results used internally to measure and
evaluate the businesses, as well as eliminations to adjust management
reporting principles to U.S. GAAP. Operating activities in Corporate
include the results of incidental businesses managed at the corporate
level along with the elimination of individual revenues and expenses
generated by certain unconsolidated investees discussed in the preced-
ing paragraph over which we exert significant influence, but do not
control. Operating elements also include certain employee benefit
costs, the costs of certain restructuring-type activities to maintain a
competitive cost structure, including manufacturing and workforce
rationalization, and other general Corporate items. The non-operating
elements in Corporate primarily include interest expense, divestiture
gains and interest and investing income. In addition, Corporate includes
the historical results of certain divested businesses. Corporate assets
primarily include cash, investment securities and all goodwill.
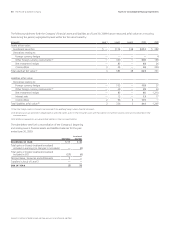
The Company had net sales in the U.S. of $31.1billion, $31.3billion
and $30.3billion for the years ended June30,2009, 2008 and 2007,
respectively. Assets in the U.S. totaled $71.9billion and $73.8billion
as of June30,2009 and 2008, respectively.
Our largest customer, Wal-Mart Stores, Inc. and its affiliates, accounted
for 15% of consolidated net sales in 2009, 2008 and 2007.
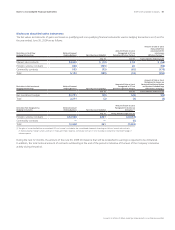
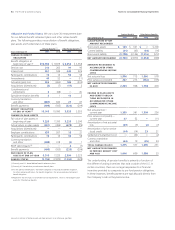
Global Segment Results Net Sales
Earnings from
Continuing
Operations
Before
Income Taxes
Net Earnings
from
Continuing
Operations
Depreciation
and
Amortization Total Assets
Capital
Expenditures
BEAUTY GBU
BEAUTY 2009 $18,789 $ 3,367 $2,531 $465 $ 11,330 $ 530
2008 19,515 3,528 2,730 454 12,260 465
2007 17,889 3,440 2,611 419 11,140 431
GROOMING 2009 7,543 2,091 1,492 710 26,192 290
2008 8,254 2,299 1,679 739 27,406 305
2007 7,437 1,895 1,383 729 27,767 314
HEALTH AND WELL-BEING GBU
HEALTH CARE 2009 13,623 3,685 2,435 435 9,373 397
2008 14,578 3,746 2,506 441 10,597 450
2007 13,381 3,365 2,233 439 9,512 374
SNACKS AND PET CARE 2009 3,114 388 234 100 1,382 72
2008 3,204 409 261 102 1,651 78
2007 2,985 381 244 121 1,570 94
HOUSEHOLD CARE GBU
FABRIC CARE AND HOME CARE 2009 23,186 4,663 3,032 578 12,457 808
2008 23,714 5,060 3,411 599 13,708 763
2007 21,355 4,636 3,119 567 12,113 706
BABY CARE AND FAMILY CARE 2009 14,103 2,827 1,770 570 7,363 902
2008 13,898 2,700 1,728 612 8,102 763
2007 12,726 2,291 1,440 671 7,731 769
CORPORATE (1) 2009 (1,329) (1,696) (201) 224 66,736 239
2008 (1,415) (2,110) (517) 181 70,268 222
2007 (941) (1,744) (967) 135 68,181 257
TOTAL COMPANY 2009 79,029 15,325 11,293 3,082 134,833 3,238
2008 81,748 15,632 11,798 3,128 143,992 3,046
2007 74,832 14,264 10,063 3,081 138,014 2,945
(1) The Corporate reportable segment includes the total assets and capital expenditures of the Coffee business prior to the divestiture in November 2008.