Proctor and Gamble 2009 Annual Report Download - page 62
Download and view the complete annual report
Please find page 62 of the 2009 Proctor and Gamble annual report below. You can navigate through the pages in the report by either clicking on the pages listed below, or by using the keyword search tool below to find specific information within the annual report.-
 1
1 -
2
-
3
-
4
-
5
-
6
-
7
-
8
-
9
-
10
-
11
-
12
-
13
-
14
-
15
-
16
-
17
-
18
-
19
-
20
-
21
-
22
-
23
-
24
-
25
-
26
-
27
-
28
-
29
-
30
-
31
-
32
-
33
-
34
-
35
-
36
-
37
-
38
-
39
-
40
-
41
-
42
-
43
-
44
-
45
-
46
-
47
-
48
-
49
-
50
-
51
-
 52
52 -
 53
53 -
 54
54 -
 55
55 -
 56
56 -
 57
57 -
 58
58 -
 59
59 -
 60
60 -
 61
61 -
 62
62 -
 63
63 -
 64
64 -
 65
65 -
 66
66 -
 67
67 -
 68
68 -
 69
69 -
 70
70 -
 71
71 -
 72
72 -
73
-
74
-
75
-
76
-
77
-
78
 |
 |

60 The Procter & Gamble Company Notes to Consolidated Financial Statements
Amounts in millions of dollars except per share amounts or as otherwise specified.
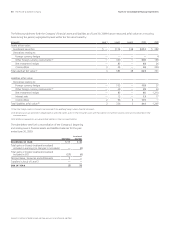
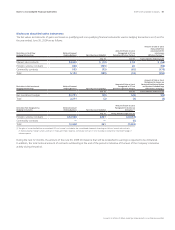
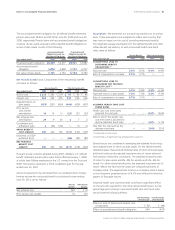
The following table sets forth the Company’s financial assets and liabilities as of June30,2009 that are measured at fair value on a recurring
basis during the period, segregated by level within the fair value hierarchy:
At June 30 Level 1 Level 2 Level 3 2009 2008
Assets at fair value:
Investment securities $
—
$174 $38 $212 $282
Derivatives relating to:
Foreign currency hedges
————
4
Other foreign currency instruments(1)
—
300
—
300 190
Net investment hedges
—
83
—
83 26
Commodities 3 25
—
28 229
Total assets at fair value(2) 3582 38 623 731
Liabilities at fair value:
Derivatives relating to:
Foreign currency hedges
—
103
—
103 37
Other foreign currency instruments(1)
—
39
—
39 33
Net investment hedges
—
85
—
85 1,210
Interest rate
—
13
—
13 17
Commodities 2 96 3101
—
Total liabilities at fair value(3) 2336 3341 1,297
(1) The other foreign currency instruments are comprised of non-qualifying foreign currency financial instruments.
(2) All derivative assets are presented in prepaid expenses and other current assets or other noncurrent assets with the exception of investment securities which are only presented in other
noncurrent assets.
(3) All liabilities are presented in accrued and other liabilities or other noncurrent liabilities.
The table below sets forth a reconciliation of the Company’s beginning
and ending Level 3 financial assets and liabilities balances for the year
ended June30,2009.
Derivatives
Investment
Securities
BEGINNING OF YEAR $17 $46
Total gains or (losses) (realized/unrealized)
included in earnings (or changes in net assets)
—
(2)
Total gains or (losses) (realized/unrealized)
included in OCI (27) (6)
Net purchases, issuances and settlements 7
—
Transfers in/(out) of Level 3
— —
END OF YEAR (3)38