Proctor and Gamble 2009 Annual Report Download - page 60
Download and view the complete annual report
Please find page 60 of the 2009 Proctor and Gamble annual report below. You can navigate through the pages in the report by either clicking on the pages listed below, or by using the keyword search tool below to find specific information within the annual report.-
 1
1 -
2
-
3
-
4
-
5
-
6
-
7
-
8
-
9
-
10
-
11
-
12
-
13
-
14
-
15
-
16
-
17
-
18
-
19
-
20
-
21
-
22
-
23
-
24
-
25
-
26
-
27
-
28
-
29
-
30
-
31
-
32
-
33
-
34
-
35
-
36
-
37
-
38
-
39
-
40
-
41
-
42
-
43
-
44
-
45
-
46
-
47
-
48
-
49
-
 50
50 -
 51
51 -
 52
52 -
 53
53 -
 54
54 -
 55
55 -
 56
56 -
 57
57 -
 58
58 -
 59
59 -
 60
60 -
 61
61 -
 62
62 -
 63
63 -
 64
64 -
 65
65 -
 66
66 -
 67
67 -
 68
68 -
 69
69 -
 70
70 -
71
-
72
-
73
-
74
-
75
-
76
-
77
-
78
 |
 |

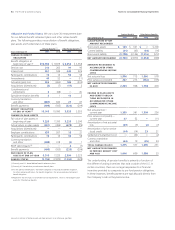
58 The Procter & Gamble Company Notes to Consolidated Financial Statements
Amounts in millions of dollars except per share amounts or as otherwise specified.
June 30 2009 2008
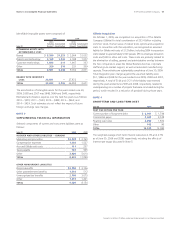
LONG-TERM DEBT
Floating rate note due July 2009 $1,750 $1,750
Floating rate note due August 2009 1,500 1,500
6.88% USD note due September 2009 1,000 1,000
Floating rate note due March 2010 750
—
2% JPY note due June 2010 522 467
4.88% EUR note due October 2011 1,411 1,573
3.38% EUR note due December 2012 1,975 2,203
4.60% USD note due January 2014 2,000
—
4.50% EUR note due May 2014 2,116 2,360
4.95% USD note due August 2014 900 900
3.50% USD note due February 2015 750
—
4.85% USD note due December 2015 700 700
5.13% EUR note due October 2017 1,552 1,731
4.70% USD note due February 2019 1,250
—
4.13% EUR note due December 2020 846 944
9.36% ESOP debentures due 2009–2021(1) 896 934
4.88% EUR note due May 2027 1,411 1,573
6.25% GBP note due January 2030 832 993
5.50% USD note due February 2034 500 500
5.80% USD note due August 2034 600 600
5.55% USD note due March 2037 1,400 1,400
Capital lease obligations 392 407
All other long-term debt 2,540 3,792
Current portion of long-term debt (6,941) (1,746)
TOTAL 20,652 23,581
(1) Debt issued by the ESOP is guaranteed by the Company and must be recorded as debt of the
Company as discussed in Note 8.
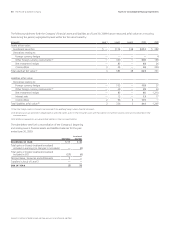
Long-term weighted average interest rates were 4.9% and 4.5% as
of June30,2009 and 2008, respectively, including the effects of
interest rate swaps and net investment hedges discussed in Note 5.
The fair value of the long-term debt was $21,514 and $23,276 at
June30,2009 and 2008, respectively. Long-term debt maturities
during the next five years are as follows: 2010
—
$6,941; 2011
—
$47;
2012
—
$1,474; 2013
—
$2,013; and 2014
—
$4,154.
The Procter & Gamble Company fully and unconditionally guarantees
the registered debt and securities issued by its 100% owned finance
subsidiaries.
NOTE 5
RISK MANAGEMENT ACTIVITIES
AND FAIR VALUE MEASUREMENTS
As a multinational company with diverse product offerings, we are
exposed to market risks, such as changes in interest rates, currency
exchange rates and commodity prices. We evaluate exposures on a
centralized basis to take advantage of natural exposure netting and
correlation. To the extent we choose to manage volatility associated
with the net exposures, we enter into various financial transactions
which we account for using the applicable accounting guidance for
derivative instruments and hedging activities. These financial transac-
tions are governed by our policies covering acceptable counterparty
exposure, instrument types and other hedging practices.
At inception, we formally designate and document qualifying instru-
ments as hedges of underlying exposures. We formally assess, both
at inception and at least quarterly, whether the financial instruments
used in hedging transactions are effective at offsetting changes in
either the fair value or cash flows of the related underlying exposure.
Fluctuations in the value of these instruments generally are offset by
changes in the fair value or cash flows of the underlying exposures
being hedged. This offset is driven by the high degree of effectiveness
between the exposure being hedged and the hedging instrument.
The ineffective portion of a change in the fair value of a qualifying
instrument is immediately recognized in earnings. The amount of
ineffectiveness recognized is immaterial for all periods presented.
Credit Risk Management
We have counterparty credit guidelines and generally enter into
transactions with investment grade financial institutions. Counterparty
exposures are monitored daily and downgrades in credit rating are
reviewed on a timely basis. Credit risk arising from the inability of a
counterparty to meet the terms of our financial instrument contracts
generally is limited to the amounts, if any, by which the counter-
party’s obligations to us exceed our obligations to the counterparty.
We have not incurred and do not expect to incur material credit losses
on our risk management or other financial instruments.
Certain of the Company’s financial instruments used in hedging
transactions are governed by industry standard netting agreements
with counterparties. If the Company’s credit rating were to fall below
the levels stipulated in the agreements, the counterparties could
demand either collateralization or termination of the arrangement.
The aggregate fair value of the instruments covered by these contrac-
tual features that are in a net liability position as of June30, 2009
was $288million. The Company has never been required to post any
collateral as a result of these contractual features.