Proctor and Gamble 2009 Annual Report Download - page 55
Download and view the complete annual report
Please find page 55 of the 2009 Proctor and Gamble annual report below. You can navigate through the pages in the report by either clicking on the pages listed below, or by using the keyword search tool below to find specific information within the annual report.-
 1
1 -
2
-
3
-
4
-
5
-
6
-
7
-
8
-
9
-
10
-
11
-
12
-
13
-
14
-
15
-
16
-
17
-
18
-
19
-
20
-
21
-
22
-
23
-
24
-
25
-
26
-
27
-
28
-
29
-
30
-
31
-
32
-
33
-
34
-
35
-
36
-
37
-
38
-
39
-
40
-
41
-
42
-
43
-
44
-
 45
45 -
 46
46 -
 47
47 -
 48
48 -
 49
49 -
 50
50 -
 51
51 -
 52
52 -
 53
53 -
 54
54 -
 55
55 -
 56
56 -
 57
57 -
 58
58 -
 59
59 -
 60
60 -
 61
61 -
 62
62 -
 63
63 -
 64
64 -
 65
65 -
66
-
67
-
68
-
69
-
70
-
71
-
72
-
73
-
74
-
75
-
76
-
77
-
78
 |
 |

The Procter & Gamble Company 53
See accompanying Notes to Consolidated Financial Statements.
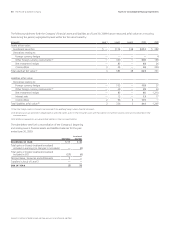
Consolidated Statements of Cash Flows
Amounts in millions; Years ended June 30 2009 2008 2007
CASH AND CASH EQUIVALENTS, BEGINNING OF YEAR $3,313 $5,354 $6,693
OPERATING ACTIVITIES
Net earnings 13,436 12,075 10,340
Depreciation and amortization 3,082 3,166 3,130
Share-based compensation expense 516 555 668
Deferred income taxes 596 1,214 253
Gain on sale of businesses (2,377) (284)(153)
Change in accounts receivable 415 432 (729)
Change in inventories 721 (1,050)(389)
Change in accounts payable, accrued and other liabilities (742)297 (278)
Change in other operating assets and liabilities (758)(1,270)(151)
Other 30 (127)719
TOTAL OPERATING ACTIVITIES 14,919 15,008 13,410
INVESTING ACTIVITIES
Capital expenditures (3,238) (3,046)(2,945)
Proceeds from asset sales 1,087 928 281
Acquisitions, net of cash acquired (368)(381)(492)
Change in investments 166 (50)673
TOTAL INVESTING ACTIVITIES (2,353) (2,549)(2,483)
FINANCING ACTIVITIES
Dividends to shareholders (5,044) (4,655)(4,209)
Change in short-term debt (2,420) 2,650 9,006
Additions to long-term debt 4,926 7,088 4,758
Reductions of long-term debt (2,587) (11,747) (17,929)
Treasury stock purchases (6,370) (10,047) (5,578)
Impact of stock options and other 681 1,867 1,499
TOTAL FINANCING ACTIVITIES (10,814)(14,844) (12,453)
EFFECT OF EXCHANGE RATE CHANGES ON CASH AND CASH EQUIVALENTS (284)344 187
CHANGE IN CASH AND CASH EQUIVALENTS 1,468 (2,041)(1,339)
CASH AND CASH EQUIVALENTS, END OF YEAR $4,781 $3,313 $5,354
SUPPLEMENTAL DISCLOSURE
Cash payments for:
Interest $1,226 $1,373 $1,330
Income Taxes 3,248 3,499 4,116
Assets acquired through non-cash capital leases 813 41
Divestiture of coffee business in exchange for shares of P&G stock 2,466
— —