Proctor and Gamble 2009 Annual Report Download - page 54
Download and view the complete annual report
Please find page 54 of the 2009 Proctor and Gamble annual report below. You can navigate through the pages in the report by either clicking on the pages listed below, or by using the keyword search tool below to find specific information within the annual report.-
 1
1 -
2
-
3
-
4
-
5
-
6
-
7
-
8
-
9
-
10
-
11
-
12
-
13
-
14
-
15
-
16
-
17
-
18
-
19
-
20
-
21
-
22
-
23
-
24
-
25
-
26
-
27
-
28
-
29
-
30
-
31
-
32
-
33
-
34
-
35
-
36
-
37
-
38
-
39
-
40
-
41
-
42
-
43
-
 44
44 -
 45
45 -
 46
46 -
 47
47 -
 48
48 -
 49
49 -
 50
50 -
 51
51 -
 52
52 -
 53
53 -
 54
54 -
 55
55 -
 56
56 -
 57
57 -
 58
58 -
 59
59 -
 60
60 -
 61
61 -
 62
62 -
 63
63 -
 64
64 -
65
-
66
-
67
-
68
-
69
-
70
-
71
-
72
-
73
-
74
-
75
-
76
-
77
-
78
 |
 |

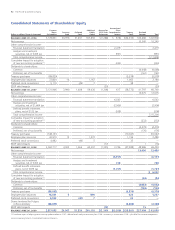
52 The Procter & Gamble Company
(1) Cumulative impact of adopting new accounting guidance relates to: 2007
—
defined benefit and post retirement plans; 2008
—
uncertainty in income taxes; 2009
—
split-dollar life insurance arrangements.
See accompanying Notes to Consolidated Financial Statements.
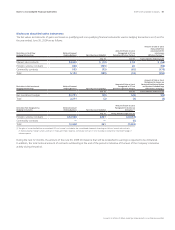
Consolidated Statements of Shareholders’ Equity
Dollars in millions/Shares in thousands
Common
Shares
Outstanding
Common
Stock
Preferred
Stock
Additional
Paid-In
Capital
Reserve for
ESOP Debt
Retirement
Accumulated
Other
Comprehensive
Income
Treasury
Stock
Retained
Earnings Total
BALANCE JUNE 30, 2006 3,178,841 $3,976 $1,451 $57,856 $(1,288) $ (518) $(34,235) $35,666 $ 62,908
Net earnings 10,340 10,340
Other comprehensive income:
Financial statement translation 2,419 2,419
Hedges and investment
securities, net of $459 tax (951)(951)
Total comprehensive income $ 11,808
Cumulative impact for adoption
of new accounting guidance(1) (333)(333)
Dividends to shareholders:
Common (4,048)(4,048)
Preferred, net of tax benefits (161)(161)
Treasury purchases (89,829) (5,578)(5,578)
Employee plan issuances 37,824 14 1,167 1,003 2,184
Preferred stock conversions 5,110 (45) 7 38
—
ESOP debt impacts (20)(20)
BALANCE JUNE 30, 2007 3,131,946 3,990 1,406 59,030 (1,308)617 (38,772) 41,797 66,760
Net earnings 12,075 12,075
Other comprehensive income:
Financial statement translation 6,543 6,543
Hedges and investment
securities, net of $1,664 tax (2,906)(2,906)
Defined benefit retirement
plans, net of $120 tax (508)(508)
Total comprehensive income $ 15,204
Cumulative impact for adoption
of new accounting guidance(1) (232)(232)
Dividends to shareholders:
Common (4,479)(4,479)
Preferred, net of tax benefits (176)(176)
Treasury purchases (148,121) (10,047) (10,047)
Employee plan issuances 43,910 12 1,272 1,196 2,480
Preferred stock conversions 4,982 (40) 5 35
—
ESOP debt impacts (17) 1 (16)
BALANCE JUNE 30, 2008 3,032,717 4,002 1,366 60,307 (1,325)3,746 (47,588) 48,986 69,494
Net earnings 13,436 13,436
Other comprehensive income:
Financial statement translation (6,151) (6,151)
Hedges and investment
securities, net of $452 tax 748 748
Defined benefit retirement
plans, net of $879 tax (1,701) (1,701)
Total comprehensive income $6,332
Cumulative impact for adoption
of new accounting guidance(1) (84) (84)
Dividends to shareholders:
Common (4,852) (4,852)
Preferred, net of tax benefits (192)(192)
Treasury purchases (98,862) (6,370) (6,370)
Employee plan issuances 16,841 5 804 428 1,237
Preferred stock conversions 4,992 (42) 7 35
—
Shares tendered for Folgers
coffee subsidiary (38,653) (2,466) (2,466)
ESOP debt impacts (15) 15
—
BALANCE JUNE 30, 2009 2,917,035 $4,007 $1,324 $61,118 $(1,340)$(3,358) $(55,961) $57,309 $ 63,099