Proctor and Gamble 2009 Annual Report Download - page 5
Download and view the complete annual report
Please find page 5 of the 2009 Proctor and Gamble annual report below. You can navigate through the pages in the report by either clicking on the pages listed below, or by using the keyword search tool below to find specific information within the annual report.-
 1
1 -
 2
2 -
 3
3 -
 4
4 -
 5
5 -
 6
6 -
 7
7 -
 8
8 -
 9
9 -
 10
10 -
 11
11 -
 12
12 -
 13
13 -
 14
14 -
 15
15 -
 16
16 -
17
-
18
-
19
-
20
-
21
-
22
-
23
-
24
-
25
-
26
-
27
-
28
-
29
-
30
-
31
-
32
-
33
-
34
-
35
-
36
-
37
-
38
-
39
-
40
-
41
-
42
-
43
-
44
-
45
-
46
-
47
-
48
-
49
-
50
-
51
-
52
-
53
-
54
-
55
-
56
-
57
-
58
-
59
-
60
-
61
-
62
-
63
-
64
-
65
-
66
-
67
-
68
-
69
-
70
-
71
-
72
-
73
-
74
-
75
-
76
-
77
-
78
 |
 |

ōNo company in the world has invested more in consumer
and market research than P&G. We interact with more
than five million consumers each year in nearly 60 countries
around the world. We conduct over 15,000 research studies
every year. We invest more than $350million a year in
consumer understanding. This results in insights that tell us
where the innovation opportunities are and how to serve and
communicate with consumers.
ōP&G is the innovation leader in our industry. Virtually all
the organic sales growth we’ve delivered in the past nine
years has come from new brands and new or improved
product innovation. We continually strengthen our innovation
capability and pipeline by investing two times more, on average,
than our major competitors. In addition, we multiply our
internal innovation capability with a global network of
innovation partners outside P&G. More than half of all product
innovation coming from P&G today includes at least one major
component from an external partner. The IRI New Product
Pacesetter Report ranks the best-selling new products in
our industry in the U.S. every year. Over the past 14 years,
P&G has had 114 top 25 Pacesetters
—
more than our six
ōP&G is the brand-building leader of our industry. We’ve built
the strongest portfolio of brands in the industry with 23billion-
dollar brands and 20 half-billion-dollar brands. These 43 brands
account for 85% of sales and more than 90% of profit.
Twelve of the billion-dollar brands are the #1 global market
share leaders of their categories. The majority of the balance
are #2. As a group, P&G’s billion-dollar brands have grown
sales at an average rate of 11% per year for the entire decade.
ōWe’ve established industry-leading go-to-market
capabilities.P&G is consistently ranked by leading retailers
in industry surveys as a preferred supplier and as the industry
leader in a wide range of capabilities including clearest
company strategy, brands most important to retailers, strong
business fundamentals and innovative marketing programs.
ōOver the decades, we have also established significantscale
advantages as a total company and in individual categories,
countries and retail channels. P&G’s scale advantage is
driven as much by knowledge sharing, common systems
and processes, and best practices as it is by size and scope.
These scale benefits enable us to deliver consistently superior
consumer and shareholder value.
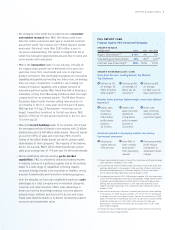
P&G REPORT CARD
Progress Against P&G’s Goals and Strategies
GROWTH RESULTS
Average annual Goals 2009 2001–2009
Organic Sales Growth(1) 4–6% 2% 5%
Core Earnings per Share Growth 10% 8%(2) 12%(3)
Free Cash Flow Productivity (4) 90% 102% 112%
GROWTH STRATEGIES (2001 – 2009)
Grow from the core: Leading Brands, Big Markets,
Top Customers
Volume up 7%,
on average, for
P&G’s 23billion-
dollar brands (5)
Volume up 6%,
on average, for
P&G’s top 16
countries (6)
Volume up 6%,
on average,
for P&G’s top 10
retail customers(6)
Develop faster-growing, higher-margin, more asset-efficient
businesses
Beauty sales
more than
doubled to
$18.8billion;
profits nearly
tripled to
$2.5billion
Health Care
sales more than
doubled to
$13.6billion;
profit increased
fourfold to
$2.4billion
Home Care
sales more than
doubled; profits
more than tripled
Accelerate growth in developing markets and among
low-income consumers
Developing
market sales up
15% per year
Over 40% of
total company
sales growth
from developing
markets
Developing market
profit margins
comparable to
developed-market
margins
(1) Organic sales exclude the impacts of acquisitions, divestitures and foreign exchange,
which were 6%, on average, in 2001
–
2009.
(2) Core earnings per share for 2009 excludes a positive $0.14 per share impact from
significant adjustments to tax reserves in 2008, a positive $0.68 per share impact
from discontinued operations in 2009 and a negative $0.09 per share impact
from incremental Folgers-related restructuring charges in 2009.
(3) Core earnings per share for 2001
–
2009 excludes a negative $0.61 per share impact
in 2001 from the Organization 2005 restructuring program charges and amortization
of goodwill and intangible assets, positive impacts of $0.06 and $0.68 per share
earnings from discontinued operations in 2001 and 2009, respectively and a
negative $0.09 per share impact from incremental Folgers-related restructuring
charges in 2009.
(4) Free cash flow productivity is the ratio of operating cash flow less capital spending
to net earnings. For 2009, we have excluded $2,011 million from net earnings due
to the gain on the sale of the Folgers business. Free cash flow productivity in 2009
equals $14,919 million of operating cash flow less $3,238 million in capital spending
divided by net earnings of $11,425 million which excludes the Folgers gain.
Reconciliations of free cash flow and free cash flow productivity for 2001
–
2009
are provided on page 48.
(5) Excludes the impact of adding newly acquired billion-dollar brands to the portfolio.
(6) Excludes the impact of adding Gillette.
The Procter & Gamble Company 3
largest competitors combined.In the last year alone, P&G
had five of the top 10 new product launches in the U.S. and
10 of the top 25.