Proctor and Gamble 2009 Annual Report Download - page 43
Download and view the complete annual report
Please find page 43 of the 2009 Proctor and Gamble annual report below. You can navigate through the pages in the report by either clicking on the pages listed below, or by using the keyword search tool below to find specific information within the annual report.-
 1
1 -
2
-
3
-
4
-
5
-
6
-
7
-
8
-
9
-
10
-
11
-
12
-
13
-
14
-
15
-
16
-
17
-
18
-
19
-
20
-
21
-
22
-
23
-
24
-
25
-
26
-
27
-
28
-
29
-
30
-
31
-
32
-
 33
33 -
 34
34 -
 35
35 -
 36
36 -
 37
37 -
 38
38 -
 39
39 -
 40
40 -
 41
41 -
 42
42 -
 43
43 -
 44
44 -
 45
45 -
 46
46 -
 47
47 -
 48
48 -
 49
49 -
 50
50 -
 51
51 -
 52
52 -
 53
53 -
54
-
55
-
56
-
57
-
58
-
59
-
60
-
61
-
62
-
63
-
64
-
65
-
66
-
67
-
68
-
69
-
70
-
71
-
72
-
73
-
74
-
75
-
76
-
77
-
78
 |
 |

Management’s Discussion and Analysis The Procter & Gamble Company 41
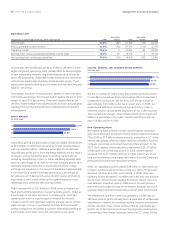
declines in U.S. all-outlet shares of Tide and Downy, partially offset by
share growth of Gain. Home Care volume was down low single digits
due to market contractions and trade inventory reductions. Batteries
volume declined high single digits due to market contractions, trade
inventory reductions and competitive activity, which drove a 1-point
market share decline of general purpose batteries.
Net earnings declined 11% to $3.0billion primarily due to reduced net
earnings margin and lower net sales. Net earnings margin contracted
130 basis points behind lower operating margin. Operating margin
was down primarily due to a commodity-driven decline in gross mar-
gin, which was partially offset by price increases and manufacturing
cost savings. Lower marketing spending as a percentage of net sales
was largely offset by higher overhead spending as a percentage of
net sales.
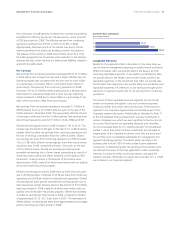
Fabric Care and Home Care net sales in 2008 increased 11% to
$23.7billion. Volume was up 6%, price increases added 1% and
favorable foreign exchange added 5% to net sales growth. This was
partially offset by a negative 1% mix impact primarily from dispropor-
tionate growth in developing regions and a shift toward larger sizes
in fabric care, both of which have selling prices below the segment
average. Fabric Care volume increased mid-single digits behind high
single-digit growth in developing regions and mid-single-digit
growth in developed regions. Growth was driven by the liquid laundry
detergent compaction launch in North America and initiative activity
on Tide, Gain, Ariel and Downy. Home Care volume was up mid-
single digits due to double-digit growth in developing regions and
high-teens growth on Febreze from the launch of Febreze Candles.
Batteries volume was up mid-single digits behind double-digit growth
in developing regions and mid-single-digit growth in developed
regions. Net earnings in Fabric Care and Home Care increased 9% to
$3.4billion in 2008 primarily behind higher net sales. Net earnings
margin was down 20 basis points primarily due to lower gross margin,
partially offset by a reduction in SG&A as a percentage of net sales.
Gross margin was down due to higher commodity costs, which more
than offset benefits from pricing, increased volume scale leverage and
manufacturing cost savings projects. SG&A improved as a percentage
of net sales due to lower overhead spending as a percentage of net
sales resulting from a focus on overhead productivity improvements.
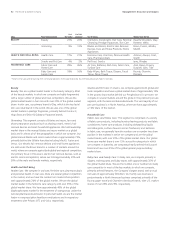
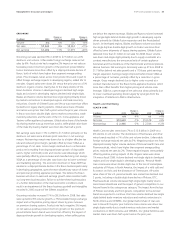
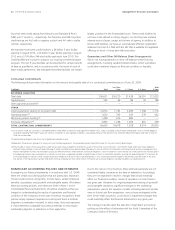
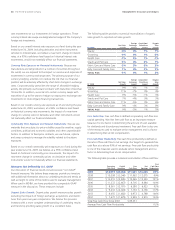
BABY CARE AND FAMILY CARE
($millions) 2009
Change vs.
Prior Year 2008
Change vs.
Prior Year
Volume n/a +1% n/a +4%
Net sales $14,103 +1% $13,898 +9%
Net earnings $1,770 +2% $1,728 +20%
Baby Care and Family Care net sales increased 1% to $14.1billion in
2009 on 1% volume growth. Pricing to help recover higher commodity
and energy costs contributed 5% to net sales growth. Unfavorable
foreign exchange reduced net sales by 4%. Negative product mix from
higher shipments of mid-tier brands, which have lower than segment
average selling prices, reduced net sales by 1%. Organic sales were up
7% on a 2% increase in organic volume. Volume growth was driven
by low single-digit growth in developing regions, while volume in
developed regions was in line with the prior year. Baby Care volume
increased low single digits due to growth of Pampers primarily in
developing regions and double-digit growth of Luvs in North America.
Our global market share of baby care was up nearly half a point.
Family Care volume was down low single digits due to the Western
European family care divestiture. Organic volume for Family Care was
up low single digits behind double-digit growth of Charmin Basic and
Bounty Basic. U.S. market share on Bounty was up nearly 1 point,
while Charmin market share remained consistent with the prior year.
Net earnings were up 2% versus the prior year to $1.8billion due to
net sales growth and higher net earnings margin. Net earnings margin
increased 10 basis points as higher gross margin was partially offset
by an increase in SG&A as a percentage of net sales and a higher
effective tax rate. Gross margin improved due to the impact of price
increases, manufacturing cost savings and more positive product mix
following the Western European family care divestiture, which more
than offset higher commodity and energy costs. SG&A as a percentage
of net sales increased due to the higher current period overhead
spending and base period reimbursements for services related to the
Western European family care divestiture, partially offset by lower
marketing spending.
Baby Care and Family Care net sales increased 9% in 2008 to
$13.9billion. Volume was up 4%, including the impact of the Western
European family care divestiture. Price increases contributed 1% to
net sales and foreign exchange had a positive 4% impact on net sales.
Organic volume and organic sales, which exclude the impacts of the
Western European family care divestiture and foreign exchange, both
grew 8%. Organic volume growth was balanced across the segment
with high single-digit growth in both Baby Care and Family Care.
Baby Care volume in developed regions was up mid-single digits
behind growth on the Pampers Baby Stages of Development and on
the Baby Dry Caterpillar Flex initiative. In developing regions, Baby
Care volume was up double digits behind continued growth on
Pampers. Family Care volume was down low single digits due to the
divestiture of the Western European family care business but was up
high single digits on an organic basis behind the Bounty and Charmin
product restages. U.S. market share on both Bounty and Charmin
was up over 1 point. Net earnings in Baby Care and Family Care were
up 20% to $1.7billion in 2008 behind higher net sales and earnings
margin expansion. Net earnings margin improved 110 basis points
primarily behind higher gross margin and lower SG&A as a percentage
of net sales. Gross margin was up due to a more profitable product
mix following the Western Europe family care divestiture, the benefit
of increased volume scale leverage, pricing and manufacturing cost
savings projects, which more than offset higher commodity and
energy costs. SG&A improved as a percentage of net sales due to
lower overhead spending as a percentage of net sales, partially offset
by higher marketing expenses as a percentage of net sales.