Proctor and Gamble 2010 Annual Report Download - page 37
Download and view the complete annual report
Please find page 37 of the 2010 Proctor and Gamble annual report below. You can navigate through the pages in the report by either clicking on the pages listed below, or by using the keyword search tool below to find specific information within the annual report.-
 1
1 -
2
-
3
-
4
-
5
-
6
-
7
-
8
-
9
-
10
-
11
-
12
-
13
-
14
-
15
-
16
-
17
-
18
-
19
-
20
-
21
-
22
-
23
-
24
-
25
-
26
-
 27
27 -
 28
28 -
 29
29 -
 30
30 -
 31
31 -
 32
32 -
 33
33 -
 34
34 -
 35
35 -
 36
36 -
 37
37 -
 38
38 -
 39
39 -
 40
40 -
 41
41 -
 42
42 -
 43
43 -
 44
44 -
 45
45 -
 46
46 -
 47
47 -
48
-
49
-
50
-
51
-
52
-
53
-
54
-
55
-
56
-
57
-
58
-
59
-
60
-
61
-
62
-
63
-
64
-
65
-
66
-
67
-
68
-
69
-
70
-
71
-
72
-
73
-
74
-
75
-
76
-
77
-
78
-
79
-
80
-
81
-
82
 |
 |

Management’s Discussion and Analysis The Procter & Gamble Company 35
RESULTS OF OPERATIONS
Net Sales
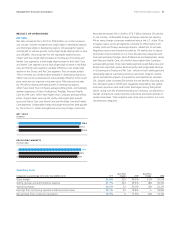
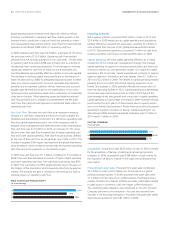
Net sales increased 3% in 2010 to $78.9billion on a 4% increase in
unit volume. Volume increased low single digits in developed regions
and mid-single digits in developing regions. All geographic regions
contributed to volume growth, led by high single-digit growth in Asia
and CEEMEA. Volume growth for the reportable segments was
mixed, with low single-digit increases in the Beauty, Grooming and
Health Care segments, a mid-single-digit increase in the Fabric Care
and Home Care segment and a high single-digit increase in the Baby
Care and Family Care segment, partially offset by a low single-digit
decline in the Snacks and Pet Care segment. Price increases added
1% to net sales as increases taken primarily in developing regions to
offset local currency devaluations were partially offset by more recent
price reductions to improve consumer value. Mix reduced net sales
by 1% behind disproportionate growth in developing regions,
which have lower than Company average selling prices, and relatively
weaker shipments of Salon Professional, Prestige, Personal Health
Care and Pet Care, which have higher than Company average selling
prices. Organic sales were up 3%, led by mid-single-digit growth
across the Fabric Care and Home Care and the Baby Care and Family
Care segments. Unfavorable foreign exchange reduced net sales growth
by 1% as the U.S. dollar strengthened versus key foreign currencies.
$.
$78.9
$.
10
08
09
NET SALES
($ billions)
32%
34%
33%
10
08
09
DEVELOPING MARKETS
(% of net sales)
Net sales decreased 3% in 2009 to $76.7billion behind a 3% decline
in unit volume. Unfavorable foreign exchange reduced net sales by
4% as many foreign currencies weakened versus the U.S. dollar. Price
increases, taken across all segments, primarily to offset higher com-
modity costs and foreign exchange impacts, added 5% to net sales.
Negative product mix reduced net sales by 1% mainly due to dispro-
portionate volume declines in our more discretionary categories and
channels (primarily Prestige, Salon Professional and Appliances), along
with Personal Health Care, all of which have higher than Company
average selling prices. Every reportable segment except Baby Care and
Family Care reported volume declines led by mid-single-digit declines
in Grooming and Snacks and Pet Care. Volume in both developed and
developing regions was below previous year levels. Organic volume,
which excludes the impact of acquisitions and divestitures, declined
2%. Organic sales increased 2% behind the net benefit of pricing and
mix. Net sales levels in 2009 were negatively impacted by the global
economic downturn and credit crisis that began during that period
which, along with the aforementioned price increases, contributed to
market contractions, trade inventory reductions and share declines in
certain businesses. These impacts were more pronounced in our more
discretionary categories.
Operating Costs
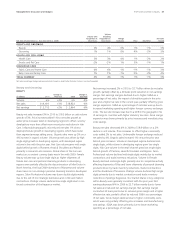
Comparisons as a percentage of net sales; Years ended June 30 2010
Basis Point
Change 2009
Basis Point
Change 2008
Gross margin 52.0% 250 49.5% (100) 50.5%
Selling, general and administrative expense 31.7% 220 29.5% (80) 30.3%
Operating margin 20.3% 30 20.0% (20 ) 20.2%
Earnings from continuing operations before income taxes 19.1% 30 18.8% 0 18.8%
Net earnings from continuing operations 13.9% 0 13.9% (30 ) 14.2%