Proctor and Gamble 2010 Annual Report Download - page 38
Download and view the complete annual report
Please find page 38 of the 2010 Proctor and Gamble annual report below. You can navigate through the pages in the report by either clicking on the pages listed below, or by using the keyword search tool below to find specific information within the annual report.-
 1
1 -
2
-
3
-
4
-
5
-
6
-
7
-
8
-
9
-
10
-
11
-
12
-
13
-
14
-
15
-
16
-
17
-
18
-
19
-
20
-
21
-
22
-
23
-
24
-
25
-
26
-
27
-
 28
28 -
 29
29 -
 30
30 -
 31
31 -
 32
32 -
 33
33 -
 34
34 -
 35
35 -
 36
36 -
 37
37 -
 38
38 -
 39
39 -
 40
40 -
 41
41 -
 42
42 -
 43
43 -
 44
44 -
 45
45 -
 46
46 -
 47
47 -
 48
48 -
49
-
50
-
51
-
52
-
53
-
54
-
55
-
56
-
57
-
58
-
59
-
60
-
61
-
62
-
63
-
64
-
65
-
66
-
67
-
68
-
69
-
70
-
71
-
72
-
73
-
74
-
75
-
76
-
77
-
78
-
79
-
80
-
81
-
82
 |
 |

36 The Procter & Gamble Company Management’s Discussion and Analysis
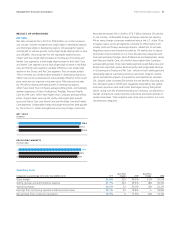
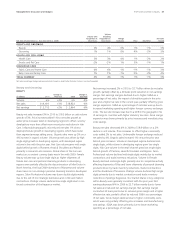
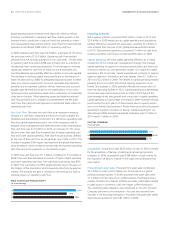
Gross margin expanded 250 basis points in 2010 to 52.0% of net sales.
Manufacturing and logistics cost savings projects and lower commodity
and energy costs positively impacted gross margin by about 280 basis
points. Volume scale leverage and price increases also contributed to
gross margin expansion. These impacts were partially offset by unfavor-
able foreign exchange and product mix impacts.
Gross margin declined 100 basis points to 49.5% of net sales in
2009. Higher commodity and energy costs, partially offset by savings
projects on raw and packing materials, negatively impacted gross
margin by about 250 basis points. Unfavorable foreign exchange and
incremental restructuring charges also negatively impacted gross
margin. These impacts were partially offset by price increases and
manufacturing and logistics cost savings.
.%
.%
.%
10
08
09
GROSS MARGIN
(% of net sales)
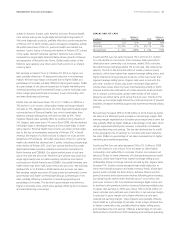
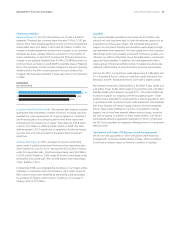
Total selling, general and administrative expenses (SG&A) increased
10% to $25.0billion in 2010 behind higher marketing, overhead and
other operating expenses. SG&A as a percentage of net sales increased
220 basis points to 31.7% due to higher marketing and other operat-
ing expenses as a percentage of net sales, while overhead spending as
a percentage of sales was in line with the prior year. Marketing spend-
ing as a percentage of net sales was up 150 basis points as additional
marketing investments, primarily to increase media impressions, and
the impact of reduced spending in the fourth quarter of 2009 were
partially offset by media rate savings. Advertising spending as a
percentage of net sales was up 110 basis points versus 2009 behind
investments to support initiatives and business growth. Overhead
spending as a percentage of net sales was consistent with the prior
year as additional spending to support business growth was offset by
productivity improvements and lower restructuring charges. Other
operating expenses as a percentage of net sales increased 70 basis
points mainly due to an increase in Venezuela-related foreign currency
exchange costs of $492million (see further discussion in the follow-
ing paragraphs) and charges for potential competition law fines of
$283million.
Because of currency restrictions in Venezuela, payments for certain
imported goods and services have historically been satisfied by
exchanging Bolivares Fuertes for U.S. dollars through securities trans-
actions in the parallel market rather than at the more favorable official
exchange rate. At the discretion of management, these securities
transactions can be utilized to manage exposure to currency move-
ments on local cash balances. A reduction in the availability of foreign
currency at the official exchange rate and an increased spread between
the official and parallel exchange rates during most of fiscal 2010
resulted in increased costs for exchange transactions executed using
securities transactions in the parallel market during 2010. For a more
detailed discussion of the impacts of and recent events in Venezuela,
see the section entitled “Venezuela Currency Impacts” at the end of
this Results of Operations section.
SG&A decreased 6% to $22.6billion in 2009 driven primarily by foreign
currency impacts and cost reduction efforts. SG&A as a percentage of
net sales was down 80 basis points due to lower marketing expenses
and the impact of foreign currency transaction gains on working
capital balances caused by strengthening of the U.S. dollar. Marketing
expenses were down as a percentage of net sales for the total
Company and for most reportable segments mainly due to media rate
reductions, foreign exchange and reductions in the amount of media
purchased primarily in the fourth fiscal quarter. Overhead spending as
a percentage of net sales was up 30 basis points versus the prior year
as productivity improvements were more than offset by the negative
impacts of sales deleverage and incremental restructuring charges.
.%
.%
.%
10
08
09
SELLING, GENERAL AND ADMINISTRATIVE EXPENSE
(% of net sales)
We fund a number of restructuring-type activities, primarily related
to manufacturing and workforce optimization efforts, to maintain a
competitive cost structure and to integrate acquired businesses.
Within our results of continuing operations, after-tax charges to fund
restructuring-type activities declined approximately $220million in
2010. In 2009, we executed approximately $270million after-tax of
additional restructuring-type activities versus 2008 in order to offset
the dilution caused by the disposition of our coffee business.
Non-Operating Items
Interest expense decreased 30% in 2010 to $946million due primarily
to a reduction in interest rates on floating rate debt and a reduction in
debt outstanding. In 2009, interest expense decreased 7% to $1.4bil-
lion primarily driven by a reduction in U.S. dollar interest rates, partially
offset by a higher debt level primarily to fund share repurchases.
Other non-operating income/(expense), net primarily includes divesti-
ture gains, interest and investment income and the provision for
income attributable to noncontrolling interests. Other non-operating
income/(expense), net declined $425million in 2010 to an expense
of $28million mainly due to divestiture gains in the prior year, which
included gains on the sale of Thermacare, Noxzema, Infusium and
other minor brands, and incremental costs in the current year associ-
ated with exercising the call option on an outstanding bond. In 2009,
other non-operating income increased $24million mainly due to
higher divestiture gains.