Proctor and Gamble 2010 Annual Report Download - page 41
Download and view the complete annual report
Please find page 41 of the 2010 Proctor and Gamble annual report below. You can navigate through the pages in the report by either clicking on the pages listed below, or by using the keyword search tool below to find specific information within the annual report.-
 1
1 -
2
-
3
-
4
-
5
-
6
-
7
-
8
-
9
-
10
-
11
-
12
-
13
-
14
-
15
-
16
-
17
-
18
-
19
-
20
-
21
-
22
-
23
-
24
-
25
-
26
-
27
-
28
-
29
-
30
-
 31
31 -
 32
32 -
 33
33 -
 34
34 -
 35
35 -
 36
36 -
 37
37 -
 38
38 -
 39
39 -
 40
40 -
 41
41 -
 42
42 -
 43
43 -
 44
44 -
 45
45 -
 46
46 -
 47
47 -
 48
48 -
 49
49 -
 50
50 -
 51
51 -
52
-
53
-
54
-
55
-
56
-
57
-
58
-
59
-
60
-
61
-
62
-
63
-
64
-
65
-
66
-
67
-
68
-
69
-
70
-
71
-
72
-
73
-
74
-
75
-
76
-
77
-
78
-
79
-
80
-
81
-
82
 |
 |

Management’s Discussion and Analysis The Procter & Gamble Company 39
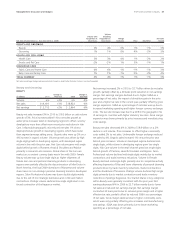
Net Sales Change Drivers vs. Year Ago (2010 vs. 2009)
Volume with
Acquisitions &
Divestitures
Volume
Excluding
Acquisitions &
Divestitures
Foreign
Exchange Price Mix/Other
Net Sales
Growth
BEAUTY AND GROOMING
Beauty 3% 4% 0% 1% -1% 3%
Grooming 1% 1% 0% 4% -2% 3%
HEALTH AND WELL-BEING
Health Care 3% 3% 0% 1% -2% 2%
Snacks and Pet Care -2% -2% 1% 3% -1% 1%
HOUSEHOLD CARE
Fabric Care and Home Care 6% 6% -1% -1% -1% 3%
Baby Care and Family Care 7% 7% -1% 0% -2% 4%
TOTAL COMPANY 4% 4% -1% 1% -1% 3%
Net sales percentage changes are approximations based on quantitative formulas that are consistently applied.
Beauty and Grooming
BEAUTY
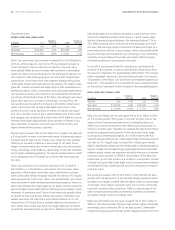
($millions) 2010
Change vs.
Prior Year 2009
Change vs.
Prior Year
Volume n/a +3% n/a -2%
Net sales $19,491 +3% $18,924 -4%
Net earnings $ 2,712 +2% $ 2,664 -6%
Beauty net sales increased 3% in 2010 to $19.5billion on unit volume
growth of 3%. Price increases added 1% to net sales growth as
earlier price increases taken in developing regions to offset currency
devaluations more than offset more recent price reductions in Hair
Care. Unfavorable geographic mix reduced net sales 1% due to
disproportionate growth in developing regions, which have lower
than segment average selling prices. Organic sales were up 3% on a
4% increase in organic volume. Volume growth was driven by high
single-digit growth in developing regions, with developed region
volume in line with the prior year. Hair Care volume grew mid-single
digits behind growth of Pantene, Head & Shoulders and Rejoice
primarily in Asia and Latin America. Global share of the hair care
market on a constant currency basis was in line with 2009. Female
Beauty volume was up low single digits as higher shipments of
female skin care and personal cleansing products in developing
regions were partially offset by the discontinuation of Max Factor in
North America, the fiscal 2009 divestiture of Noxzema and volume
share losses on non-strategic personal cleansing brands in developed
regions. Salon Professional volume was down double digits mainly
due to the exit of non-strategic businesses and continued market
contractions. Prestige volume declined low single digits due to con-
tinued contraction of the fragrance market.
Net earnings increased 2% in 2010 to $2.7billion driven by net sales
growth, partially offset by a 20-basis point reduction in net earnings
margin. Net earnings margins declined due to higher SG&A as a
percentage of net sales, the impact of divestiture gains in the prior
year and a higher tax rate in the current year, partially offset by gross
margin expansion. SG&A as a percentage of net sales was up due to
increased marketing spending and higher foreign currency exchange
costs. The tax rate increase was due to a shift in the geographic mix
of earnings to countries with higher statutory tax rates. Gross margin
expansion was driven primarily by price increases and manufacturing
costs savings.
Beauty net sales decreased 4% in 2009 to $18.9billion on a 2%
decline in unit volume. Price increases to offset higher commodity
costs added 2% to net sales. Unfavorable foreign exchange reduced
net sales by 4%. Organic sales increased 1% versus the prior year
behind price increases. Volume in developed regions declined mid-
single digits, while volume in developing regions grew low single
digits. Hair Care volume in the retail channel grew low single digits
behind growth of Pantene, Head & Shoulders and Rejoice. Salon
Professional volume declined mid-single digits mainly due to market
contractions and trade inventory reductions. Volume in Female
Beauty declined mid-single digits primarily due to competitive activity
affecting shipments of Olay and lower shipments of personal cleansing
products driven by trade inventory reductions, market contractions
and the divestiture of Noxzema. Prestige volume declined high single
digits primarily due to market contractions and trade inventory
reductions of prestige fragrances. Our market shares in key categories
within Beauty were generally consistent with the prior year. Net
earnings decreased 6% in 2009 to $2.7billion mainly due to lower
net sales and reduced net earnings margin. Net earnings margin
contracted 30 basis points due to reduced gross margin and a higher
effective tax rate, partially offset by reduced SG&A as a percentage
of net sales. Gross margin declined due to higher commodity costs,
which were only partially offset by price increases and manufacturing
cost savings. SG&A was down primarily due to lower marketing
spending as a percentage of net sales.