Proctor and Gamble 2010 Annual Report Download - page 74
Download and view the complete annual report
Please find page 74 of the 2010 Proctor and Gamble annual report below. You can navigate through the pages in the report by either clicking on the pages listed below, or by using the keyword search tool below to find specific information within the annual report.-
 1
1 -
2
-
3
-
4
-
5
-
6
-
7
-
8
-
9
-
10
-
11
-
12
-
13
-
14
-
15
-
16
-
17
-
18
-
19
-
20
-
21
-
22
-
23
-
24
-
25
-
26
-
27
-
28
-
29
-
30
-
31
-
32
-
33
-
34
-
35
-
36
-
37
-
38
-
39
-
40
-
41
-
42
-
43
-
44
-
45
-
46
-
47
-
48
-
49
-
50
-
51
-
52
-
53
-
54
-
55
-
56
-
57
-
58
-
59
-
60
-
61
-
62
-
63
-
 64
64 -
 65
65 -
 66
66 -
 67
67 -
 68
68 -
 69
69 -
 70
70 -
 71
71 -
 72
72 -
 73
73 -
 74
74 -
 75
75 -
 76
76 -
 77
77 -
 78
78 -
 79
79 -
 80
80 -
 81
81 -
 82
82
 |
 |

72 The Procter & Gamble Company Notes to Consolidated Financial Statements
Amounts in millions of dollars except per share amounts or as otherwise specified.
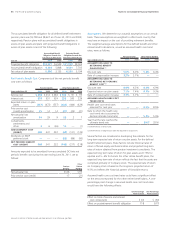
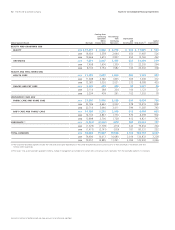
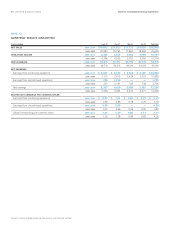
Global Segment Results Net Sales
Earnings from
Continuing
Operations
Before
Income Taxes
Net Earnings
from
Continuing
Operations
Depreciation
and
Amortization Total Assets (2) Capital
Expenditures
BEAUTY AND GROOMING GBU
BEAUTY 2010 $ 19,491 $ 3,648 $ 2,712 $ 503 $ 11,825 $ 534
2009 18,924 3,558 2,664 454 11,987 526
2008 19,666 3,673 2,827 450 12,760 462
GROOMING 2010 7,631 2,007 1,477 625 21,259 259
2009 7,408 1,900 1,359 721 22,205 294
2008 8,103 2,154 1,582 743 23,302 308
HEALTH AND WELL-BEING GBU
HEALTH CARE 2010 11,493 2,809 1,860 385 7,142 383
2009 11,288 2,786 1,835 369 7,206 372
2008 12,087 3,030 2,021 372 8,088 420
SNACKS AND PET CARE 2010 3,135 499 326 92 1,237 86
2009 3,114 388 234 100 1,123 72
2008 3,204 409 261 102 1,303 78
HOUSEHOLD CARE GBU
FABRIC CARE AND HOME CARE 2010 23,805 5,076 3,339 604 9,650 766
2009 23,186 4,663 3,032 578 10,419 808
2008 23,714 5,060 3,411 599 11,387 763
BABY CARE AND FAMILY CARE 2010 14,736 3,270 2,049 612 6,406 852
2009 14,103 2,827 1,770 570 6,259 902
2008 13,898 2,700 1,728 612 6,821 763
CORPORATE (1) 2010 (1,353) (2,262) (817) 287 70,653 187
2009 (1,329) (1,709) (214) 224 75,634 264
2008 (1,415) (2,141) (539) 181 80,331 252
TOTAL COMPANY 2010 78,938 15,047 10,946 3,108 128,172 3,067
2009 76,694 14,413 10,680 3,016 134,833 3,238
2008 79,257 14,885 11,291 3,059 143,992 3,046
(1) The Corporate reportable segment includes the total assets and capital expenditures of the coffee and pharmaceuticals businesses prior to their divestitures in November 2008 and
October 2009, respectively.
(2) Prior years’ total assets have been updated to reflect a change in management accountability for certain items, primarily accounts receivable, from the reportable segments to Corporate.