Proctor and Gamble 2010 Annual Report Download - page 79
Download and view the complete annual report
Please find page 79 of the 2010 Proctor and Gamble annual report below. You can navigate through the pages in the report by either clicking on the pages listed below, or by using the keyword search tool below to find specific information within the annual report.-
 1
1 -
2
-
3
-
4
-
5
-
6
-
7
-
8
-
9
-
10
-
11
-
12
-
13
-
14
-
15
-
16
-
17
-
18
-
19
-
20
-
21
-
22
-
23
-
24
-
25
-
26
-
27
-
28
-
29
-
30
-
31
-
32
-
33
-
34
-
35
-
36
-
37
-
38
-
39
-
40
-
41
-
42
-
43
-
44
-
45
-
46
-
47
-
48
-
49
-
50
-
51
-
52
-
53
-
54
-
55
-
56
-
57
-
58
-
59
-
60
-
61
-
62
-
63
-
64
-
65
-
66
-
67
-
68
-
 69
69 -
 70
70 -
 71
71 -
 72
72 -
 73
73 -
 74
74 -
 75
75 -
 76
76 -
 77
77 -
 78
78 -
 79
79 -
 80
80 -
 81
81 -
 82
82
 |
 |

The Procter & Gamble Company 77
P&G is recognized as a leading global company, including a #6 ranking
on Fortune’s “Global Most Admired Companies,” the #2 ranking on
Fortune’s “Top Companies for Leaders” survey, the #3 ranking on
Barron’s “World’s Most Respected Companies List,” a #12 ranking on
Bloomberg Businessweek’s list of “World’s Most Innovative Companies,”
a ranking among Bloomberg Businessweek/Hay Group’s Twenty Best
Companies for Leadership, a #2 ranking on the AMR Research Supply
Chain Top 25 and the only company to have been in the Top 5 for six
consecutive years, top rankings on the Dow Jones Sustainability Index
from 2000 to 2010, a #13 ranking on the list of the Global 100 Most
Sustainable Corporations in the World, and a consistent #1 ranking
within our industry on Fortune’s Most Admired list for 25 of 26 total
years and for 13 years in a row. P&G was recognized during the year
by SymphonyIRI Group as the most innovative manufacturer in the
consumer packaged goods industry for the last decade — presenting
the Company with its “Outstanding Achievement in Innovation” award.
P&G’s commitment to creating a diverse workplace has been recog-
nized by the National Association for Female Executives (Top 50
Companies for Executive Women), Working Mother magazine (100
Best Companies for Working Mothers and Top 20 Best Companies for
Multicultural Women), Black Enterprise magazine (40 Best Companies
for Diversity), and Diversity Inc. (#18 ranking on the Top 50
Companies for Diversity and #6 ranking on the Top 10 Companies for
Global Diversity).
Supplier diversity is a fundamental business strategy that strengthens
our innovation and go-to-market capabilities and touches and
improves the lives of our diverse suppliers, their employees and the
communities in which they live and work. In 2010, P&G spent more
than $2 billion with minority- and women-owned businesses. Since
2005, P&G has been a member of the Billion Dollar Roundtable, a
forum of 17 corporations that spend more than $1 billion annually
with diverse suppliers.
Recognition
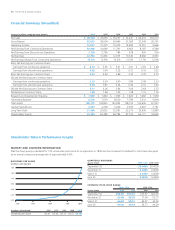
SHAREHOLDER RETURN
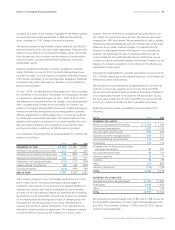
The following graph compares the cumulative total return of P&G’s
common stock for the 5-year period ending June30, 2010, against
the cumulative total return of the S&P500 Stock Index (broad market
comparison) and the S&P500 Consumer Staples Index (line of business
comparison). The graph and table assume $100 was invested on
June30, 2005, and that all dividends were reinvested.
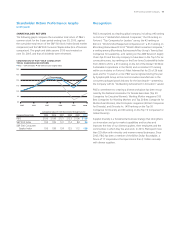
Shareholder Return Performance Graphs
(continued)
Cumulative Value of $100 Investment, through June 30
Company Name / Index 2005 2006 2007 2008 2009 2010
P&G $100 $108 $121 $123 $106 $128
S&P 500 Index 100 109 131 114 84 96
S&P 500 Consumer
Staples Index 100 108 124 125 112 128
80
90
100
110
120
130
140
P&G
2010
2009200820072005 2006
COMPARISON OF FIVE-YEAR CUMULATIVE
TOTAL SHAREHOLDER RETURN
S&P 500 Consumer Staples Index
S&P 500 Index