Proctor and Gamble 2010 Annual Report Download - page 43
Download and view the complete annual report
Please find page 43 of the 2010 Proctor and Gamble annual report below. You can navigate through the pages in the report by either clicking on the pages listed below, or by using the keyword search tool below to find specific information within the annual report.-
 1
1 -
2
-
3
-
4
-
5
-
6
-
7
-
8
-
9
-
10
-
11
-
12
-
13
-
14
-
15
-
16
-
17
-
18
-
19
-
20
-
21
-
22
-
23
-
24
-
25
-
26
-
27
-
28
-
29
-
30
-
31
-
32
-
 33
33 -
 34
34 -
 35
35 -
 36
36 -
 37
37 -
 38
38 -
 39
39 -
 40
40 -
 41
41 -
 42
42 -
 43
43 -
 44
44 -
 45
45 -
 46
46 -
 47
47 -
 48
48 -
 49
49 -
 50
50 -
 51
51 -
 52
52 -
 53
53 -
54
-
55
-
56
-
57
-
58
-
59
-
60
-
61
-
62
-
63
-
64
-
65
-
66
-
67
-
68
-
69
-
70
-
71
-
72
-
73
-
74
-
75
-
76
-
77
-
78
-
79
-
80
-
81
-
82
 |
 |

Management’s Discussion and Analysis The Procter & Gamble Company 41
activity in Western Europe, Latin America and Asia. Personal Health
Care volume was up low single digits behind higher shipments of
Vicks and diagnostic products, partially offset by a continuing decline
of Prilosec OTC in North America due to increased competitive activity.
All-outlet value share of the U.S. personal health care market has
declined 1 point, led by a 5-share point decline of Prilosec OTC’s share
of the upper stomach remedies segment. Feminine Care volume
increased low single digits behind initiative-driven growth of Always
and expansion of Naturella into China. Global market share of the
feminine care category was down about half a point on a constant
currency basis.
Net earnings increased 1% to $1.9billion for 2010 on higher net
sales, partially offset by a 10-basis point reduction in net earnings
margin. Net earnings margin contracted due to higher SG&A as a
percentage of net sales, partially offset by higher gross margin. SG&A
as a percentage of net sales increased due to higher marketing and
overhead spending and incremental foreign currency exchange costs.
Gross margin grew behind price increases, lower commodity costs
and manufacturing cost savings.
Health Care net sales were down 7% to $11.3billion in 2009 on a
3% decline in unit volume. Unfavorable foreign exchange reduced
net sales by 5%. Negative product mix from disproportionately higher
volume declines of Personal Health Care, which have higher than
segment average selling prices, reduced net sales by 2%. These
negative impacts were partially offset by positive pricing impacts of
3%. Organic sales were down 1% versus fiscal 2008. Volume declined
mid-single digits in developed regions and low single digits in devel-
oping regions. Personal Health Care volume was down double digits
due to the loss of marketplace exclusivity of Prilosec OTC in North
America, the impact of a mild cold and flu season on Vicks and the
divestiture of Thermacare. All-outlet value share of the U.S. personal
health care market has declined over 2 points, including a double-digit
share decline of Prilosec OTC. Oral Care volume declined low single
digits behind trade inventory reductions and market contractions in
North America and CEEMEA. Our global market share of oral care
was in line with the prior year. Feminine Care volume was down low
single digits mainly due to trade inventory reductions and market
contractions in North America and CEEMEA. Our global feminine care
market share was down half a point versus the prior year. Net earnings
declined 9% to $1.8billion in 2009 mainly due to lower net sales.
Net earnings margin was down 50 basis points due primarily to lower
gross margin and higher overhead spending as a percentage of net
sales, partially offset by a reduction in marketing spending as a
percentage of net sales. The decline in gross margin was driven by
higher commodity costs, which were partially offset by price increases
and manufacturing cost savings.
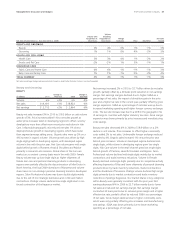
SNACKS AND PET CARE
($millions) 2010
Change vs.
Prior Year 2009
Change vs.
Prior Year
Volume n/a -2% n/a -6%
Net sales $3,135 +1% $3,114 -3%
Net earnings $ 326 +39% $ 234 -10%
Snacks and Pet Care net sales increased 1% in 2010 to $3.1billion
on a 2% decline in unit volume. Price increases, taken primarily to
offset prior-year commodity cost increases, added 3% to net sales.
Favorable foreign exchange added 1% to net sales. Mix reduced net
sales by 1% due to the discontinuation of certain premium snack
products, which have higher than segment average selling prices, and
higher shipments of large size pet products, which have lower than
segment average selling prices. Organic sales were in line with the
prior year. Volume in Snacks was down mid-single digits behind
volume share losses driven by lower merchandising activity in North
America and the discontinuation of certain premium snack products.
On a constant currency basis, global market share of the snacks
category was down half a point versus the prior year. Volume in Pet
Care was up low single digits behind the continued success of product
initiatives, increased marketing support and incremental merchandising
activity.
Net earnings increased 39% to $326million in 2010 driven by higher
net sales and a 290-basis point increase in net earnings margin. Net
earnings margin expanded due to higher gross margin and a lower tax
rate, partially offset by higher SG&A as a percentage of net sales. Gross
margin expanded behind price increases, commodity cost declines
and manufacturing cost savings. The tax rate declined due to a shift
in the geographic mix of earnings to countries with lower statutory
tax rates. SG&A as a percentage of net sales increased due to higher
marketing and overhead spending.
Snacks and Pet Care net sales decreased 3% to $3.1billion in 2009
on a 6% decline in unit volume. Price increases to offset higher
commodity costs added 9% to net sales. Product mix reduced net
sales by 2% due to lower shipments of Eukanuba and premium snack
products, which have higher than segment average selling prices.
Unfavorable foreign exchange reduced net sales by 4%. Organic sales
increased 1%. Snacks volume decreased high single digits due to
lower merchandising support and trade inventory levels, a high base
period, which included the Rice Infusion, Extreme Flavors and Stix
product launches and volume share declines following price increases.
Our global snacks market share declined about 1 point versus the
prior year. Volume in Pet Care declined mid-single digits mainly due
to declines in the premium nutrition business following multiple price
increases. Net earnings in 2009 were down 10% to $234million on
lower net sales and a 60-basis point reduction in net earnings margin.
A reduction in gross margin and a higher effective tax rate each
reduced net earnings margin. These impacts were partially offset by
lower SG&A as a percentage of net sales. Gross margin declined due
to higher commodity costs, partially offset by higher selling prices
and manufacturing cost savings. SG&A as a percentage of net sales
declined due to reductions in both marketing and overhead spending.