Proctor and Gamble 2010 Annual Report Download - page 70
Download and view the complete annual report
Please find page 70 of the 2010 Proctor and Gamble annual report below. You can navigate through the pages in the report by either clicking on the pages listed below, or by using the keyword search tool below to find specific information within the annual report.-
 1
1 -
2
-
3
-
4
-
5
-
6
-
7
-
8
-
9
-
10
-
11
-
12
-
13
-
14
-
15
-
16
-
17
-
18
-
19
-
20
-
21
-
22
-
23
-
24
-
25
-
26
-
27
-
28
-
29
-
30
-
31
-
32
-
33
-
34
-
35
-
36
-
37
-
38
-
39
-
40
-
41
-
42
-
43
-
44
-
45
-
46
-
47
-
48
-
49
-
50
-
51
-
52
-
53
-
54
-
55
-
56
-
57
-
58
-
59
-
 60
60 -
 61
61 -
 62
62 -
 63
63 -
 64
64 -
 65
65 -
 66
66 -
 67
67 -
 68
68 -
 69
69 -
 70
70 -
 71
71 -
 72
72 -
 73
73 -
 74
74 -
 75
75 -
 76
76 -
 77
77 -
 78
78 -
 79
79 -
 80
80 -
81
-
82
 |
 |

68 The Procter & Gamble Company Notes to Consolidated Financial Statements
Amounts in millions of dollars except per share amounts or as otherwise specified.
Employee Stock Ownership Plan
We maintain the ESOP to provide funding for certain employee
benefits discussed in the preceding paragraphs.
The ESOP borrowed $1.0billion in 1989 and the proceeds were used
to purchase Series A ESOP Convertible ClassA Preferred Stock to fund
a portion of the U.S. DC plan. Principal and interest requirements of
the borrowing were paid by the Trust from dividends on the preferred
shares and from advances provided by the Company. The original
borrowing of $1.0billion has been repaid in full, and advances from
the Company of $160 remain outstanding at June30, 2010. Each
share is convertible at the option of the holder into one share of the
Company’s common stock. The dividend for the current year was
equal to the common stock dividend of $1.80 per share. The liquidation
value is $6.82 per share.
In 1991, the ESOP borrowed an additional $1.0billion. The proceeds
were used to purchase Series B ESOP Convertible ClassA Preferred
Stock to fund a portion of retiree health care benefits. These shares,
net of the ESOP’s debt, are considered plan assets of the other retiree
benefits plan discussed above. Debt service requirements are funded by
preferred stock dividends, cash contributions and advances provided
by the Company, of which $336 is outstanding at June30, 2010. Each
share is convertible at the option of the holder into one share of the
Company’s common stock. The dividend for the current year was equal
to the common stock dividend of $1.80 per share. The liquidation
value is $12.96 per share.
Our ESOP accounting practices are consistent with current ESOP
accounting guidance, including the permissible continuation of certain
provisions from prior accounting guidance. ESOP debt, which is guaran-
teed by the Company, is recorded as debt (see Note 4) with an offset to
the reserve for ESOP debt retirement, which is presented within share-
holders’ equity. Advances to the ESOP by the Company are recorded as
an increase in the reserve for ESOP debt retirement. Interest incurred on
the ESOP debt is recorded as interest expense. Dividends on all preferred
shares, net of related tax benefits, are charged to retained earnings.
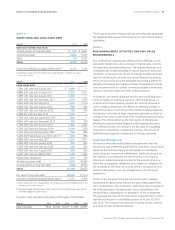
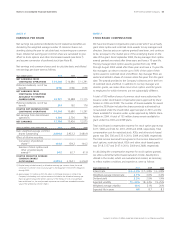
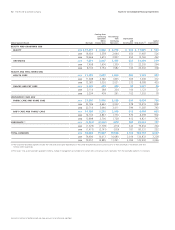
The series A and B preferred shares of the ESOP are allocated to
employees based on debt service requirements, net of advances
made by the Company to the Trust. The number of preferred shares
outstanding at June30 was as follows:
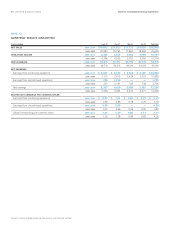
Shares in thousands 2010 2009 2008
Allocated 54,542 56,818 58,557
Unallocated 14,762 16,651 18,665
TOTAL SERIES A 69,304 73,469 77,222
Allocated 20,752 20,991 21,134
Unallocated 41,347 42,522 43,618
TOTAL SERIES B 62,099 63,513 64,752
For purposes of calculating diluted net earnings per common share,
the preferred shares held by the ESOP are considered converted from
inception.
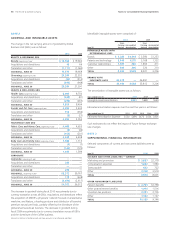
NOTE 9
INCOME TAXES
Income taxes are recognized for the amount of taxes payable for the
current year and for the impact of deferred tax liabilities and assets,
which represent future tax consequences of events that have been
recognized differently in the financial statements than for tax purposes.
Deferred tax assets and liabilities are established using the enacted
statutory tax rates and are adjusted for any changes in such rates in
the period of change.
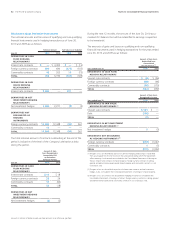
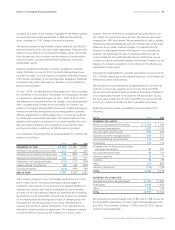
Earnings from continuing operations before income taxes consisted
of the following:
Years ended June 30 2010 2009 2008
United States $ 8,368 $ 8,409 $ 8,167
International 6,679 6,004 6,718
TOTAL 15,047 14,413 14,885
Income taxes on continuing operations consisted of the following:
Years ended June 30 2010 2009 2008
CURRENT TAX EXPENSE
U.S. federal $ 2,154 $ 1,619 $ 670
International 1,616 1,268 1,515
U.S. state and local 295 229 188
4,065 3,116 2,373
DEFERRED TAX EXPENSE
U.S. federal 253 595 1,272
International and other (217) 22 (51)
36 617 1,221
TOTAL TAX EXPENSE 4,101 3,733 3,594
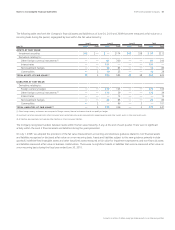
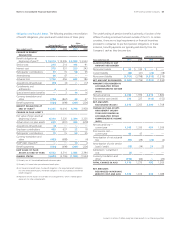
A reconciliation of the U.S. federal statutory income tax rate to our
actual income tax rate on continuing operations is provided below:
Years ended June 30 2010 2009 2008
U.S. federal statutory income tax rate 35.0% 35.0% 35.0%
Country mix impacts of foreign
operations -7.5% -7.1% -6.8%
Income tax reserve adjustments -0.4% -1.3% -3.4%
Patient Protection and Affordable
Care Act 1.0% 0.0% 0.0%
Other -0.8% -0.7% -0.7%
EFFECTIVE INCOME TAX RATE 27.3% 25.9% 24.1%
Income tax reserve adjustments represent changes in our net liability
for uncertain tax positions related to prior year tax positions.
In March 2010, the Patient Protection and Affordable Care Act (PPACA)
was signed into law. One of the provisions of the PPACA changed the
taxability of federal subsidies received by plan sponsors that provide
retiree prescription drug benefits at least equivalent to Medicare PartD