Proctor and Gamble 2010 Annual Report Download - page 63
Download and view the complete annual report
Please find page 63 of the 2010 Proctor and Gamble annual report below. You can navigate through the pages in the report by either clicking on the pages listed below, or by using the keyword search tool below to find specific information within the annual report.-
 1
1 -
2
-
3
-
4
-
5
-
6
-
7
-
8
-
9
-
10
-
11
-
12
-
13
-
14
-
15
-
16
-
17
-
18
-
19
-
20
-
21
-
22
-
23
-
24
-
25
-
26
-
27
-
28
-
29
-
30
-
31
-
32
-
33
-
34
-
35
-
36
-
37
-
38
-
39
-
40
-
41
-
42
-
43
-
44
-
45
-
46
-
47
-
48
-
49
-
50
-
51
-
52
-
 53
53 -
 54
54 -
 55
55 -
 56
56 -
 57
57 -
 58
58 -
 59
59 -
 60
60 -
 61
61 -
 62
62 -
 63
63 -
 64
64 -
 65
65 -
 66
66 -
 67
67 -
 68
68 -
 69
69 -
 70
70 -
 71
71 -
 72
72 -
 73
73 -
74
-
75
-
76
-
77
-
78
-
79
-
80
-
81
-
82
 |
 |

Notes to Consolidated Financial Statements The Procter & Gamble Company 61
Amounts in millions of dollars except per share amounts or as otherwise specified.
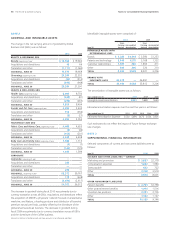
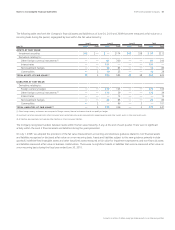
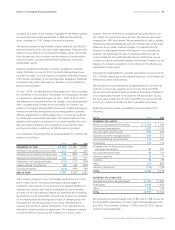
The following table sets forth the Company’s financial assets and liabilities as of June30, 2010 and 2009 that were measured at fair value on a
recurring basis during the period, segregated by level within the fair value hierarchy:
Level 1 Level 2 Level 3 Total
June 30 2010 2009 2010 2009 2010 2009 2010 2009
ASSETS AT FAIR VALUE:
Investment securities $12 $ — $ — $174 $45 $38 $ 57 $212
Derivatives relating to:
Other foreign currency instruments (1) — — 81 300 — — 81 300
Interest rates — — 191 — — — 191 —
Net investment hedges — — 14 83 — — 14 83
Commodities — 3 10 25 — — 10 28
TOTAL ASSETS AT FAIR VALUE (2) 12 3 296 582 45 38 353 623
LIABILITIES AT FAIR VALUE:
Derivatives relating to:
Foreign currency hedges — —177 103 — — 177 103
Other foreign currency instruments (1) — —175 39 — — 175 39
Interest rates — ——13 — — — 13
Net investment hedges — —23 85 — — 23 85
Commodities — 2 — 96 — 3 — 101
TOTAL LIABILITIES AT FAIR VALUE (3) — 2 375 336 — 3 375 341
(1) Other foreign currency instruments are comprised of foreign currency financial instruments that do not qualify as hedges.
(2) Investment securities are presented in other noncurrent assets and all derivative assets are presented in prepaid expenses and other current assets or other noncurrent assets.
(3) All liabilities are presented in accrued and other liabilities or other noncurrent liabilities.
The Company recognizes transfers between levels within the fair value hierarchy, if any, at the end of each quarter. There was no significant
activity within the Level 3 financial assets and liabilities during the years presented.
On July1, 2009, we adopted the provisions of the fair value measurement accounting and disclosure guidance related to non-financial assets
and liabilities recognized or disclosed at fair value on a non-recurring basis. Assets and liabilities subject to this new guidance primarily include
goodwill, indefinite-lived intangible assets and other long-lived assets measured at fair value for impairment assessments and non-financial assets
and liabilities measured at fair value in business combinations. There were no significant assets or liabilities that were re-measured at fair value on
a non-recurring basis during the fiscal year ended June30, 2010.