Proctor and Gamble 2010 Annual Report Download - page 67
Download and view the complete annual report
Please find page 67 of the 2010 Proctor and Gamble annual report below. You can navigate through the pages in the report by either clicking on the pages listed below, or by using the keyword search tool below to find specific information within the annual report.-
 1
1 -
2
-
3
-
4
-
5
-
6
-
7
-
8
-
9
-
10
-
11
-
12
-
13
-
14
-
15
-
16
-
17
-
18
-
19
-
20
-
21
-
22
-
23
-
24
-
25
-
26
-
27
-
28
-
29
-
30
-
31
-
32
-
33
-
34
-
35
-
36
-
37
-
38
-
39
-
40
-
41
-
42
-
43
-
44
-
45
-
46
-
47
-
48
-
49
-
50
-
51
-
52
-
53
-
54
-
55
-
56
-
 57
57 -
 58
58 -
 59
59 -
 60
60 -
 61
61 -
 62
62 -
 63
63 -
 64
64 -
 65
65 -
 66
66 -
 67
67 -
 68
68 -
 69
69 -
 70
70 -
 71
71 -
 72
72 -
 73
73 -
 74
74 -
 75
75 -
 76
76 -
 77
77 -
78
-
79
-
80
-
81
-
82
 |
 |

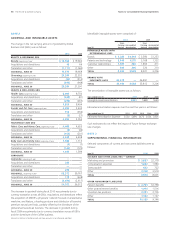
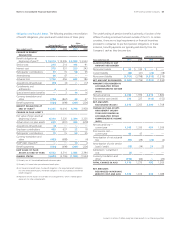
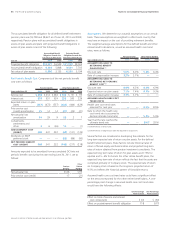
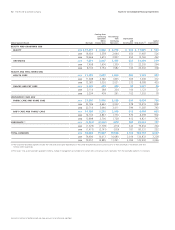
Notes to Consolidated Financial Statements The Procter & Gamble Company 65
Amounts in millions of dollars except per share amounts or as otherwise specified.
Obligation and Funded Status. The following provides a reconciliation
of benefit obligations, plan assets and funded status of these plans:
Pension Benefits (1) Other
Retiree Benefits (2)
Years ended June 30 2010 2009 2010 2009
CHANGE IN BENEFIT
OBLIGATION
Benefit obligation at
beginning of year (3) $ 10,016 $ 10,095 $ 3,928 $ 3,553
Service cost 218 214 103 91
Interest cost 579 551 253 243
Participants’ contributions 19 15 58 55
Amendments 66 47 ——
Actuarial loss 1,738 456 633 186
Acquisitions (divestitures) (13) (3) —(17)
Curtailments and
settlements 43——
Special termination benefits —314 16
Currency translation and
other (798) (867) 30 27
Benefit payments (584) (498) (241) (226)
BENEFIT OBLIGATION AT
END OF YEAR (3) 11,245 10,016 4,778 3,928
CHANGE IN PLAN ASSETS
Fair value of plan assets at
beginning of year 6,310 7,225 2,394 3,225
Actual return on plan assets 839 (401) 596 (678)
Acquisitions (divestitures) (6) ———
Employer contributions 439 657 22 18
Participants’ contributions 19 15 58 55
Currency translation and
other (455) (688) —(4)
ESOP debt impacts (4) ——14 4
Benefit payments (584) (498) (241) (226)
FAIR VALUE OF PLAN
ASSETS AT END OF YEAR 6,562 6,310 2,843 2,394
FUNDED STATUS (4,683) (3,706) (1,935) (1,534)
(1) Primarily non-U.S.-based defined benefit retirement plans.
(2) Primarily U.S.-based other postretirement benefit plans.
(3) For the pension benefit plans, the benefit obligation is the projected benefit obligation.
For other retiree benefit plans, the benefit obligation is the accumulated postretirement
benefit obligation.
(4) Represents the net impact of ESOP debt service requirements, which is netted against
plan assets for other retiree benefits.
The underfunding of pension benefits is primarily a function of the
different funding incentives that exist outside of the U.S. In certain
countries, there are no legal requirements or financial incentives
provided to companies to pre-fund pension obligations. In these
instances, benefit payments are typically paid directly from the
Company’s cash as they become due.
Pension Benefits Other Retiree Benefits
Years ended June 30 2010 2009 2010 2009
CLASSIFICATION OF NET
AMOUNT RECOGNIZED
Noncurrent assets $ 56 $ 133 $ — $ —
Current liability (38) (41) (20) (18)
Noncurrent liability (4,701) (3,798) (1,915) (1,516)
NET AMOUNT RECOGNIZED (4,683) (3,706) (1,935) (1,534)
AMOUNTS RECOGNIZED IN
ACCUMULATED OTHER
COMPREHENSIVE INCOME
(AOCI)
Net actuarial loss 3,038 1,976 2,319 1,860
Prior service cost (credit) 275 227 (119) (152)
NET AMOUNTS
RECOGNIZED IN AOCI 3,313 2,203 2,200 1,708
CHANGE IN PLAN ASSETS
AND BENEFIT OBLIGA-
TIONS RECOGNIZED IN
ACCUMULATED OTHER
COMPREHENSIVE INCOME
(AOCI)
Net actuarial loss —
current year 1,343 1,335 491 1,309
Prior service cost —
current year 66 47 ——
Amortization of net actuarial
loss (91) (29) (20) (2)
Amortization of prior service
(cost) / credit (15) (14) 21 23
Settlement / curtailment
cost (3) ———
Currency translation and
other (190) (64) —(25)
TOTAL CHANGE IN AOCI 1,110 1,275 492 1,305
NET AMOUNTS
RECOGNIZED IN PERIODIC
BENEFIT COST AND AOCI 1,579 1,616 349 1,088