Proctor and Gamble 2010 Annual Report Download - page 46
Download and view the complete annual report
Please find page 46 of the 2010 Proctor and Gamble annual report below. You can navigate through the pages in the report by either clicking on the pages listed below, or by using the keyword search tool below to find specific information within the annual report.-
 1
1 -
2
-
3
-
4
-
5
-
6
-
7
-
8
-
9
-
10
-
11
-
12
-
13
-
14
-
15
-
16
-
17
-
18
-
19
-
20
-
21
-
22
-
23
-
24
-
25
-
26
-
27
-
28
-
29
-
30
-
31
-
32
-
33
-
34
-
35
-
 36
36 -
 37
37 -
 38
38 -
 39
39 -
 40
40 -
 41
41 -
 42
42 -
 43
43 -
 44
44 -
 45
45 -
 46
46 -
 47
47 -
 48
48 -
 49
49 -
 50
50 -
 51
51 -
 52
52 -
 53
53 -
 54
54 -
 55
55 -
 56
56 -
57
-
58
-
59
-
60
-
61
-
62
-
63
-
64
-
65
-
66
-
67
-
68
-
69
-
70
-
71
-
72
-
73
-
74
-
75
-
76
-
77
-
78
-
79
-
80
-
81
-
82
 |
 |

44 The Procter & Gamble Company Management’s Discussion and Analysis
global pharmaceuticals divestiture and improved collection efforts.
Inventory contributed to operating cash flow despite growth in the
business due to a reduction in days on hand due primarily to inven-
tory management improvement efforts. Cash flow from discontinued
operations contributed $285million to operating cash flow.
In 2009, operating cash flow was $14.9billion, a decrease of 1% versus
the prior year total of $15.0billion. Operating cash flow resulted
primarily from net earnings adjusted for non-cash items. The decrease
in operating cash flow versus 2008 was primarily due to a decline in
net earnings from continuing operations. A net decrease in working
capital also added to cash flow as lower accounts receivable and
inventory balances were partially offset by a decline in accounts payable.
The decrease in working capital was primarily due to the impact of
lower net sales and our ability to adequately adjust production to better
meet unit volume requirements. Accounts receivable days declined
primarily due to improved collection efforts. Inventory and accounts
payable days declined due in part to the optimization of our manu-
facturing process and inventory levels and a moderation of commodity
costs late in the year. Other operating assets and liabilities reduced
cash flow primarily due to changes in postretirement benefit plans.
Cash flow from discontinued operations contributed $662million to
operating cash flow.
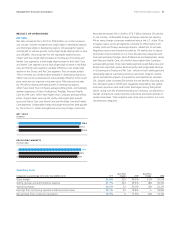
Free Cash Flow. We view free cash flow as an important measure
because it is one factor impacting the amount of cash available for
dividends and discretionary investment. It is defined as operating cash
flow less capital expenditures and is one of the measures used to
evaluate senior management and determine their at-risk compensation.
Free cash flow was $13.0billion in 2010, an increase of 11% versus
the prior year. Free cash flow increased due to higher operating cash
flow and lower capital spending. Free cash flow productivity, defined
as the ratio of free cash flow to net earnings, was 102% in 2010. This
includes a negative 23% impact resulting from the global pharmaceu-
ticals divestiture, which increased net earnings and lowered operating
cash flow due to tax payments on the divestiture gain.
In 2009, free cash flow was $11.7billion, compared to $12.0billion in
2008. Free cash flow decreased as a result of higher capital spending
and lower operating cash flow. Free cash flow productivity was 87%
in 2009. This was below our 90% target primarily due to the gain on
the Folgers coffee transaction which lowered productivity by approxi-
mately 15% because the gain is included in net earnings but had no
material impact on operating cash flow.
%
%
%
10
08
09
FREE CASH FLOW PRODUCTIVITY
(% of net earnings)
Investing Activities
Net investing activities consumed $597million of cash in 2010 and
$2.4billion in 2009 mainly due to capital spending and acquisitions,
partially offset by proceeds from asset sales, including $3.0billion in
cash received from the sale of our global pharmaceuticals business
in 2010. Discontinued operations consumed $1million of cash from
investing activities in 2010 and contributed $69million in 2009.
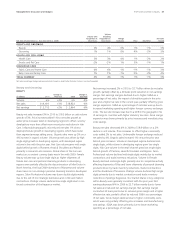
Capital Spending. We view capital spending efficiency as a critical
component of our overall cash management strategy. We manage
capital spending to support our business growth plans and have cost
controls to deliver our cash generation targets. Our target for capital
spending is 4% of net sales. Capital expenditures, primarily to support
capacity expansion, innovation and cost savings, were $3.1billion in
2010 and $3.2billion in 2009. The decline in capital spending resulted
primarily from cost control efforts and capacity expansion of our
Family Care business in 2009, partially offset by the construction of
new manufacturing facilities in 2010. Capital spending as a percentage
of net sales improved 30 basis points to 3.9% in 2010 behind the
scale leverage of net sales growth and a reduction in capital spending.
Capital spending as a percentage of net sales in 2009 increased 40basis
points versus the prior year to 4.2% primarily due to capacity expan-
sion of our Family Care business in North America as well as increased
spending to support innovation in Beauty. Capital spending for our
discontinued coffee and pharmaceuticals businesses was $1million in
2010 and $11million in 2009.
.9%
.%
.%
10
08
09
CAPITAL SPENDING
(% of net sales)
Acquisitions. Acquisitions used $425million of cash in 2010 primarily
for the acquisition of Natura, a holistic and naturals pet products
company. In 2009, acquisitions used $368million of cash mainly for
the acquisition of Nioxin, a leader in the scalp care professional hair
care market.
Proceeds from Asset Sales. Proceeds from asset sales contributed
$3.1billion to cash in 2010 mainly due to the sale of our global
pharmaceuticals business. In 2009, proceeds from asset sales were
$1.1billion from the sale of our coffee business, Thermacare and a
number of other minor brands. Of these proceeds, $350million related
to debt issued in connection with the Folgers coffee transaction.
The underlying debt obligation was transferred to The J.M. Smucker
Company pursuant to the transaction. No cash was received from
Smucker in the exchange transaction. Proceeds from asset sales within
discontinued operations were $81million in 2009.